SmartReach Reports and Analytics To Boost Performance
On this page
As a sales leader, you know how crucial it is to monitor and measure the performance of your sales team and their sales-related activities. You need to know how well they are meeting their quotas, how they are engaging with prospects, how they are closing deals, and lot more. That’s where sales reports and analytics come in handy.
According to the recent report on managing salesperson activity, sales teams spend an average of 6 hours every week on sales reporting activities!
So, if we go by numbers alone, a sales team technically loses up to 24 hours of productivity every month because they are spending all that time only creating sales reports and doing analysis of them!
Now, imagine, losing a day’s worth of productivity every month just on paperwork and admin tasks.
That’s not the only challenge here.
Managing sales reports and analytics can also be a daunting and time-consuming task, especially if you’re dealing with multiple sources of data, complex calculations, and manual processes. The hours dedicated to reporting can go up drastically.
Thus, you need a tool or system that can automate your sales outreach and simplify your reporting process, and provide you with actionable insights.
That’s why we created SmartReach.io a powerful sales engagement platform with a vision to change the B2B sales landscape forever.
SmartReach.io’s primary goal is to increase productivity of our users; and keeping that in mind, we provide comprehensive reports and analytics that will enhance your sales engagement strategies. Our sales reports and analytics are designed to simplify analysis and reduce time taken in decision-making, keeping in mind the needs of sales leaders.
This article will be entirely focused on the reports and analytics available in SmartReach and how you can leverage them to improve your team and sales performance.
Let’s get started.
What can you analyze with SmartReach Reports and Analytics?
At a top level, you will be able to analyse the following with all the detailed reporting that SmartReach provides :
- Cold Email Automation
- Multichannel Outreach
- Team & Campaign Performance
- Deal Management & Forecasting
- Prospect Management
- Outreach Response Management
Before we get into the details of each reports, let’s try and understand what sales leaders can achieve with SmartReach reports and analytics.
✅ Daily Insights
1. Team Activity Report
– Drill down into your team’s outreach activities, including emails, calls, task status, and prospect additions.
– Stay on top of your team’s daily progress.
2. Opportunities Pipeline
– Monitor account progress based on deal value.
– Identify delayed follow-ups and unblock team members.
3. Prospect Category Report
– Analyze prospecting quality at a campaign level.
– Get details on Out Of Office(ooo), Auto Replies, Do Not Contact(DNC), Interested, and Not Interested.
✅ Weekly Focus
1. Deal Health Insights
– Prioritize high-value deals in the active pipeline.
– Identify deals at risk and take proactive steps.
2. Reply Sentiment Analysis
– Forecast better by analyzing positive deals in your sales pipeline.
**3. **Sequence Performance and Template Reports
– Dive into individual performance.
– Coach underperformers and share successful templates for new outreach campaigns.
✅ Monthly Strategy
1. Top of the Funnel Report (a.k.a Prospects Report)
– Understand and drill down into prospects contacted, replies, and meetings booked.
– Improve pipeline creation and benchmark team members.
2. Team Performance Report
– Identify training needs based on campaign-level insights.
-Track touch points, tasks completed, and meetings conversion rate.
3. Team Leaderboard Reports
– Celebrate wins and identify improvement areas.
– Analyze open rates, replies, bounces, and unsubscribes.
That’s not all.
Smartreach comes with a lot of unique analytical functions as well that let you drill down into your reports using parameters such as date range, campaign name, communication channel, prospect name, campaign category, etc. These analytical properties will help you get tailored campaign data based on wide range of set parameters.
SmartReach Reports and Analytics: What does it track and How does it help?
SmartReach.io reports and analytics give you a comprehensive overview of how your sales outreach is performing at both the campaign and account levels, so you can identify winners and spot areas for improvement.
The areas covered are Cold Email Automation, Multichannel Outreach, Team & Campaign Performance, Deal Management & Forecasting, Prospect Management, Account-based analysis, and Outreach Response Management
- Cold email automation
SmartReach’s cold email automation features empower sales teams to streamline outreach, gain actionable insights, and drive B2B relationship.
The following reports help you to make data-based decisions:
#1 Email Templates report
Email Template report serves as a valuable tool for sales leaders to assess the effectiveness of their email outreach campaigns and optimize their email template strategies.
✅ Data sets
Templates used, template owner name, prospect contacted, prospects opened, total replies, total clicks, total bounces, total unsubscriptions
✅ Use case
Evaluate the performance of different email templates by analyzing the engagement metrics. This helps in understanding which templates are resonating with prospects and driving engagement. Compare the ones performing better than the others and share them with the team.
The report also provides insights into the performance of individual template owners, allowing sales leaders to identify top-performing team members and leverage their expertise.
✅ How to analyze
Analyze the performance of each template and identify the ones that have a proven track record of success.
Segment prospects based on template usage. For example, analyze how different templates perform with specific industries, job titles, or geographic regions.
Look for trends and patterns. Identify common characteristics of high-performing templates and apply these insights to refine and improve existing templates or use them as a basis for creating new templates
✅ Benefits
Save time and effort by using the best templates for your outreach and continuously improving them based on the feedback and results you get from running your campaigns. Get insights into areas where additional training may be needed to improve template effectiveness.
#2 Link clicks report
✅ Data sets
Links used in the campaign, total clicks, unique clicks
✅ Use case
Get a detailed breakdown of the number and frequency of clicks for each link to understand which one is driving the most engagement.
Assess the success of outreach campaigns by tracking link clicks which helps you determine the messages that resonate with the audience and drive action.
Identify high-performing content through the links clicked. This helps you optimize landing pages, email campaigns, and social media posts based on the most clicked links.
Also, measure how your campaigns lead prospects to desired outcomes, such as form submissions, downloads, or purchases.
✅ How to analyze
Compare the total clicks for different links. Identify which links receive the most engagement. Look for patterns related to content type, placement, or call-to-action (CTA).
Experiment with different types of links and their placement in your emails to see which ones generate the most clicks and interest from your prospects.
✅ Benefits
Link clicks reveal what interests prospects. You can understand which content drives engagement and conversions and adjust your strategies accordingly.
By analyzing link clicks, you can gain valuable insights to improve the design of your CTAs (call to action). This includes experimenting with different wording, button placement, and overall design elements to maximize click-through rates.
Boost your engagement and conversion rates by using the links that resonate the most with your prospects and lead them to the next step in your sales funnel.
��Please note that this report is available only if you enable click tracking
#3 Spam test report
✅ Data sets
Automated checks on your email account and campaign set-up. It highlights issues and tells you how to address them easily.
✅ Use case
Detect potential issues in your email outreach that might cause your emails to be flagged as spam and affect your email deliverability. Verify sender authenticity (SPF, DKIM, DMARC), fix broken links & dangerous elements, identify blacklisted IPs – all in a single spam test.
✅ How to analyse
Review the spam test report and follow the suggestions to improve your email quality and avoid spam filters. Make sure your emails are relevant, personalized, and compliant with the best practices for cold emailing.
✅ Benefits
Spam test reports help you maintain a good sender reputation. It ensures your emails reach your prospects’ primary inboxes, increasing your deliverability rates by avoiding spam issues.
#4 Click tracking report
✅ Data sets
Links used, campaign name, clicked by (prospect name), clicked at (date).
Get detailed analytics to drill down on the report based on campaign name, campaign owner, campaign tags, prospect list, and duration.
✅ Use case
This allows you to identify highly engaged prospects who may be more receptive to further outreach or follow-up.
Also, you will be able to understand which links resonate with prospects allows you to optimize your campaigns. So, you can allocate resources to the most effective links and adjust strategies for underperforming ones.
✅ How to analyze
Drill down into specific campaigns and assess link performance. Find out the links that contribute to conversion.
Explore who clicked on specific links. Connect this data to prospect profiles and understand their interests. For example, if a prospect clicked on a pricing link, they might be further along in the buying journey
✅ Benefits
Knowing which links prospects clicked allows your team to perform personalized follow-up. Your sales team can tailor their communication based on prospect interests, increasing the chances of conversion.
Click tracking also helps spot poorly performing CTAs. Fixing these issues improves the overall user experience and boosts conversion rates.
#5 Best time to send Report
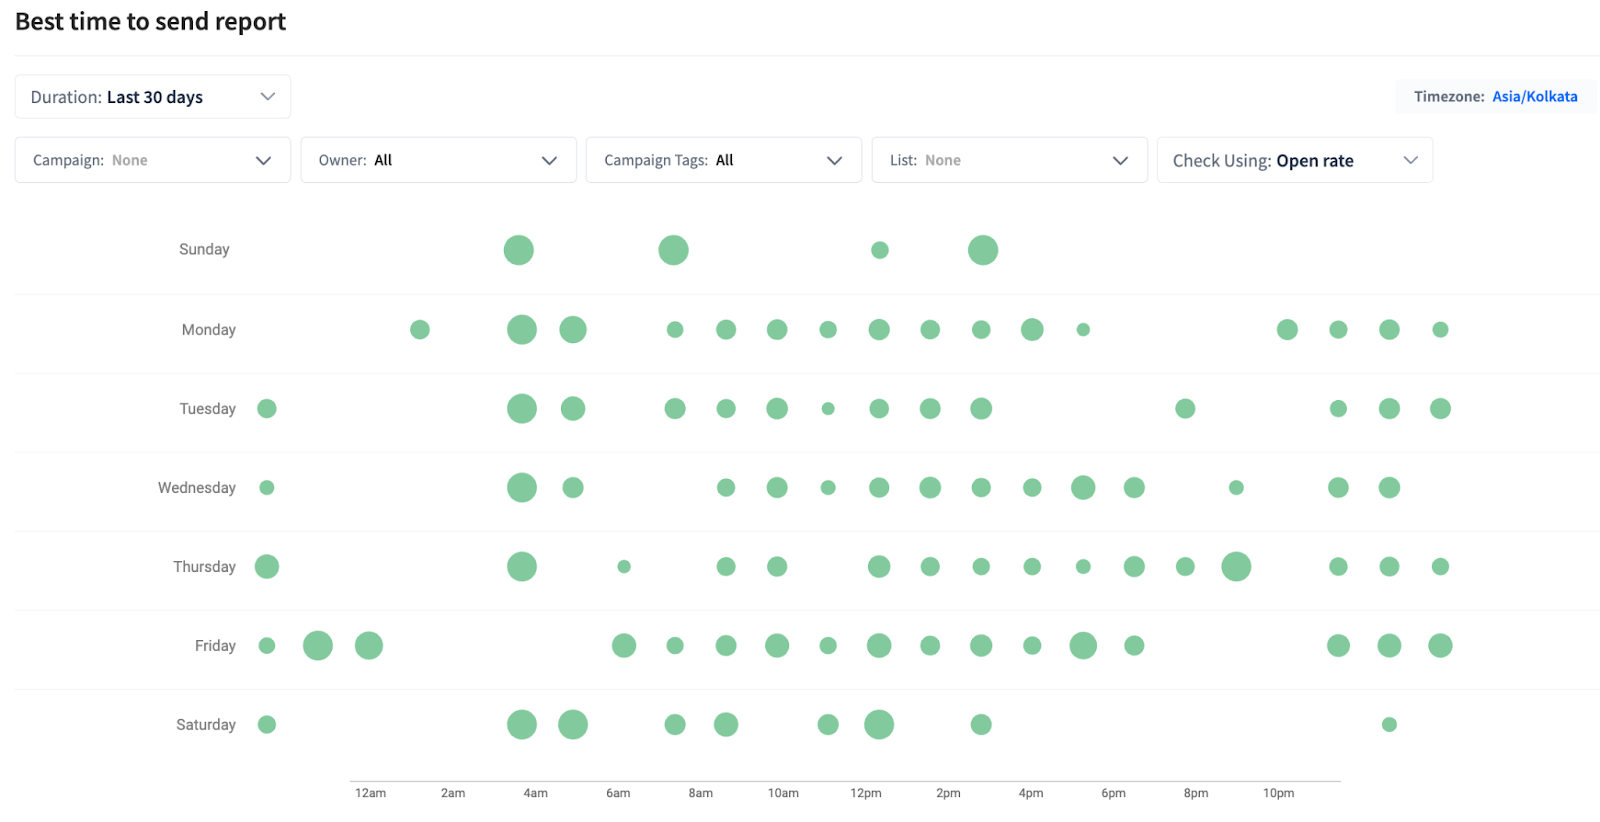
✅ Data sets
This is a pictorial report that denotes engagement (opens, replies, contact rate) against the day of the week and time of day
You could further drill down by campaign name, campaign owner, campaign tags, prospect list and duration
✅ Use case
Determine the most effective days and times to send outreach with peak engagement periods, maximizing the chances of prospects opening and responding.
Use the report to schedule campaigns strategically. Whether it’s a product launch, follow-up, or promotional email, knowing the best time ensures higher visibility and engagement.
✅ How to analyze
Use the best time to send report to schedule your emails to be delivered at the optimal times for your prospects. Adjust your sending times based on the data and feedback you get from your campaigns.
Also, analyze how engagement varies over campaign duration. Are there specific days or weeks within a campaign that yield higher responses?
✅ Benefits
Increase the chances of your emails getting noticed, read, and acted upon by sending them at the right time for your prospects.
Avoid wasting effort on poorly timed outreach. Help your sales team focus their energy on moments when prospects are most receptive.
#6 Sender email report
✅ Data sets
You’ll get a report on the number of prospects contacted, replies and bounces with regard to each sender email address.
You can drill down based on campaign name, campaign owner, campaign tags, or prospect list. Also, you can group the sender emails by domain.
✅ Use case
Assign team members to specific email accounts for better accountability and management.
Assess the performance of different sender email addresses. By analyzing email replies and bounces associated with each sender, you can identify which sender emails yield better engagement and which ones need improvement.
Grouping sender emails by domain provides insights into the reputation and reliability of different email providers. You can identify patterns related to deliverability and engagement based on sender domains.
✅ How to analyze
Use the sending email report to monitor and evaluate the performance of each email account and team member. Identify and resolve any issues that might affect your email deliverability, such as bounces, spam complaints, or low open rates. Optimize your email rotations based on the results and feedback you get from your campaigns.
Drill down into specific campaigns to see how different sender emails perform within those campaigns. For example, compare sender performance for a product launch campaign versus a follow-up campaign.
✅ Benefits
Improve your team’s productivity and efficiency by using the sending email report to assign and manage your email accounts and team members.
Armed with insights from this report, you can optimize their campaigns. They can adjust sender emails based on performance metrics and improve overall campaign effectiveness.
- Multichannel outreach
SmartReach offers multichannel outreach features via email, LinkedIn, Calls, Text messages and Whatsapp making it more diversified outreach platform for customer engagement and conversion. Here’s how different reports and analytics work for multichannel outreach for SmartReach –
#1 Tasks report
The multichannel task execution report helps assess the efficiency and effectiveness of your team’s outreach efforts across different channels.
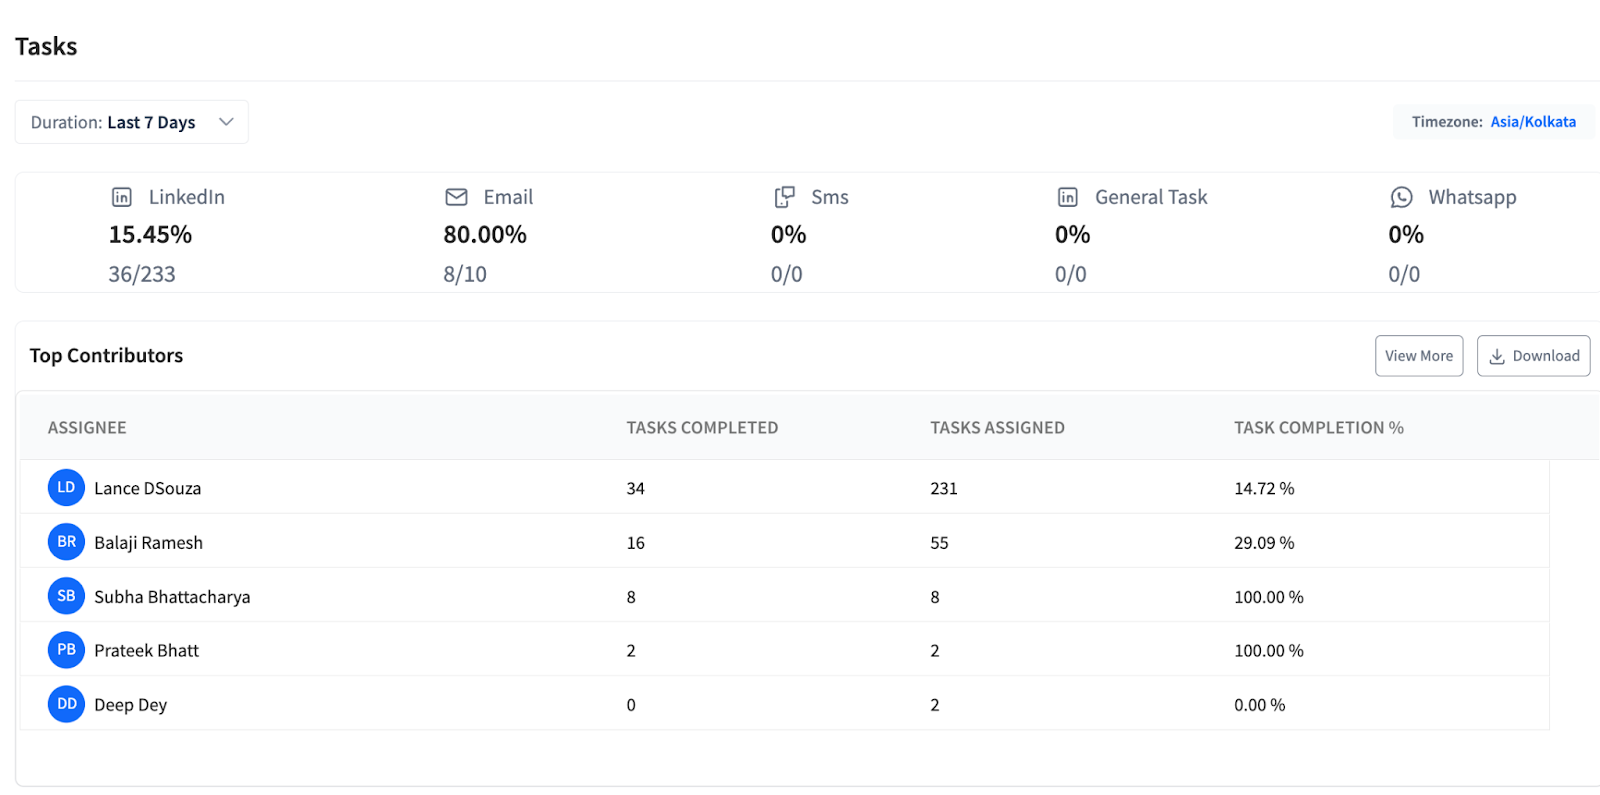
✅ Data sets
Total no. of tasks assigned, completed, and its completion rate with bifurcation of different outreach channels. This is provided as per the task assignee and the channel of the task.
✅ Use case
Building a predictable pipeline is all about executing tasks consistently. Any team member not completing – affects the overall team performance, and this affects sales in the long run
Use the report to evaluate the performance of youy sales team in executing assigned tasks across various outreach channels. Helps identify top performers, assess overall productivity, and pinpoint areas for improvement.
You could then assign tasks to team members based on their expertise, workload, and availability. The report helps ensure that tasks are distributed evenly and aligned.
✅ How to analyze
Use this report to monitor and evaluate how many of the outreach tasks your team members have completed for a given period.
Compare task completion rates for different team members using the best mentorship software. Identify high-performers and areas for improvement. Consider coaching or training for team members with lower completion rates.
Optimize your task management and workflow based on the data and feedback you get from your campaigns.
✅ Benefits
Enhance your team’s productivity and efficiency by using the tasks report. It helps to manage and track your sales teams’ tasks and activities regularly. High-performing team members can be recognized and rewarded. You can provide positive feedback and incentives, boosting morale and productivity.
#2 LinkedIn Activity Report
✅ Data sets
Total no. of LinkedIn tasks assigned, total no. of LinkedIn tasks completed. You would be able to set a date range and filter as per team member and campaign.
✅ Use case
The LinkedIn Activity Report provides valuable insights into your team’s engagement efforts on LinkedIn. It allows you to track and analyze the volume of connection requests sent, the number of connections accepted, and those still pending, offering a clear view of your team’s networking effectiveness for building relationships with prospects.
✅ How to analyze
Closely monitor the completion rates of LinkedIn tasks, both assigned and accomplished. This involves examining the outreach performance by tracking connection requests and responses, which provides insights into the team’s networking success.
By filtering down this data by team member or campaign, leaders can identify high-performing strategies and areas needing improvement, enabling them to tailor their coaching and optimize LinkedIn engagement tactics for better sales results.
✅ Benefits
This report helps in optimizing LinkedIn outreach strategies to monitor team performance, boost engagement and conversion rates. This, in turn, can lead to a more robust sales pipeline and improved sales outcomes.
#3 Call activity reports
✅ Data sets
You get the total number of inbound and outbound calls, along with a bifurcation of average call time duration, the number of prospects contacted, and the contact rate which reflects the ratio of total dials to calls picked up.
Additionally, the report details call dispositions like the total number of hung-up calls, no-answer calls, answered calls, and busy calls. It also provides a breakdown of call responses categorized by sentiment, including positive interactions, objections, referrals, and others, as reported by the caller.
This comprehensive data set allows for granular analysis of call activities and caller sentiment, enabling targeted improvements in communication strategies.
You would be able to set a date range and filter as per team member and campaign.
✅ Use case
Use the calling reports to see how your calling outreach is performing and how your prospects are reacting to your calls. Test different variables, such as call scripts, call times, and follow-up frequency, to see which ones result in the highest contact and connection rates.
✅ How to analyse
By analyzing contact rates and call dispositions you can gain insights into customer engagement levels. You can identify patterns such as peak call times, customer availability, and reasons for call disconnections, which can inform adjustments to calling strategies.
By analyzing the types of responses received, you can identify areas for improvement in your calling strategies and tailor approaches to increase conversion rates.
✅ Benefits
Get actionable insights to optimize your calling processes, improve team performance, and ultimately drive better results and greater revenue generation.
#4 Call sentiment report
The call sentiment report serves as a powerful tool for sales leaders to gauge the effectiveness of their sales efforts and identify areas for improvement.
✅ Data sets
This report gives you the total number of calls with a bifurcation of the numbers of positive or negative sentiments and their sub-dispositions, the number of prospects that opted out (DNC). Here again, you can set a date range and drill down as per team member or campaign
✅ Use case
As a sales leader, you can assess the performance of individual team members or campaigns by analyzing the distribution of positive and negative sentiments. This helps identify top performers and areas that may require additional support or training.
It provides insights into the number of prospects who opted out (Do Not Call – DNC), allowing sales leaders to ensure compliance with regulations
By drilling down into sentiment data by campaign, you can evaluate the success of different campaigns and adjust strategies accordingly. Identify the campaigns that are resonating well with prospects and which ones may need to be refined or discontinued.
✅ How to analyze
Use the call sentiment report to see how your prospects or accounts feel about your calls and your offer. Analyze the sentiment of each reply and identify the ones that indicate interest, satisfaction, or dissatisfaction. Use the feedback to improve your call quality and offer value.
✅ Benefits
The call sentiment report provides deeper insight into customer perception. This allows for targeted improvements in communication strategies and customer relationship management.
Armed with comprehensive call sentiment data, you can make informed decisions about resource allocation, training initiatives, and campaign optimization.
Monitoring the number of prospects who opted out (DNC) helps ensure compliance with regulations and reduces the risk of fines or penalties. As a sales leaders can proactively address any compliance issues and reinforce adherence to best practices.
#5 Channel attribution report
A Channel Attribution Report offers businesses valuable insights into the performance of various marketing channels, including engagement levels, reply rates, positive sentiments, and closed deals through AI reporting.
✅ Data sets
Channel wise bifurcation on the highest engagement, number of replies, ones with positive sentiments and deals closed
✅ Use case
Identify the channels that contribute the most to your outreach engagement and conversions. Conduct a microscopic analysis of how channels work together and determine the most effective channel for conversions.
✅ How to analyse
Use the channel attribution report to see how your prospects or accounts interact with your different channels, such as email, LinkedIn, texts, or phone. Analyze the impact of each channel on your campaign goals and outcomes. Optimize your channel mix and strategy based on the results and feedback you get from your campaigns.
✅ Benefits
By leveraging this data, you can allocate resources more effectively, tailor sales outreach strategies to resonate with audiences, prioritize channels for customer interaction, and optimize sales efforts.
- Team and campaign performance
As a sales leader, you have to keep your team collaboration game stronger. So, you need to track the performance of your team closely. Here’s how you can achieve that using the team and campaign performance reports SmartReach provides –
#1 Team leaderboard report
✅ Data sets
No. of campaigns sent, no. of prospects contacted, no. of prospects opened, no. of prospects replied, no. of prospects bounced, no. of prospects clicked, no. of prospects unsubscribed for each team member.
✅ Use case
Use the team leaderboard report to see how your team members are performing and how they rank among their peers in terms of overall outreach efforts. Recognize and reward the top performers and provide feedback and coaching to the ones who need improvement in their outreach.
This report not only quantifies the outreach efforts of each sales rep of your team but also provides a qualitative analysis of how these efforts translate into actual customer engagement.
✅ How to analyze
Compare performance metrics across team members. Look for patterns, such as who consistently receives good email open rates or who has the highest reply rates.
Get valuable insights into your team’s performance, showing strengths and areas for improvement based on campaign metrics like email opens, replies, bounces, and unsubscribes.
Compare team performance against industry benchmarks or historical data to assess the overall sales rep’s efficiency.
✅ Benefits
Gain visibility into individual and team performance to quickly identify top performers and areas for improvement in your sales team.
By analyzing individual metrics, you can provide targeted coaching. For instance, if a team member has a low reply rate, they can offer guidance on crafting more compelling emails. Celebrate achievements publicly by recognizing top performers during team meetings or through incentives. This fosters a positive team culture.
Also, make better resource allocation decisions. If one team member consistently outperforms others, consider reallocating leads or providing additional support to struggling team members.
#2 Team Prospecting Report
✅ Data sets
No. of prospects added to CRM, No. of prospects added to campaign
✅ Use case
Periodically analyze the effectiveness of your team’s “prospecting” and the rate of adding prospects to your CRM or campaign. Align this with prospect engagement and replies insights to enhance overall prospect interactions.
✅ How to analyze
Use the team prospecting report to see how your team members are prospecting and how they are engaging with their prospects. Compare and contrast the prospecting and engagement rates of your team members and identify the best practices and areas for improvement.
✅ Benefits
Increase your sales pipeline and conversions by using the team prospecting report to optimize your team prospecting and engagement.
#3 Multichannel Engagement Report
The multichannel engagement report serves as a comprehensive tool for sales leaders to assess the effectiveness of their outreach efforts across various communication channels and campaigns.
✅ Data sets
You will receive a comprehensive breakdown of the total number of prospects contacted, segmented by channels like email, LinkedIn, calling, WhatsApp, and text.
This includes the total replies per channel, average touchpoints per engaged prospect, conversion rates, and funnel progression.
Additionally, you’ll get insights into the top-performing campaigns and the top 7 team members based on prospect outreach.
✅ Use case
Detailed analytics to focus efforts where engagement is highest. Average sales touchpoints and tracking of positive replies help to refine and optimize sales outreach strategies.
✅ How to analyse
Use the multichannel engagement report to see how your prospects or accounts are engaging with your different channels, such as email, LinkedIn, texts, or phone. Analyze the average number of touchpoints and the positive replies for each channel and campaign. Optimize your sales outreach strategies based on the results and feedback you get from your campaigns.
You can run touchpoint analysis by calculating the average number of touchpoints for each engaged prospect to understand the level of interaction required to convert prospects into customers. Identify opportunities to streamline and optimize the sales process for improved efficiency and effectiveness.
✅ Benefits
Maximize your engagement and conversion rates by using the multichannel engagement report. It enables you to make informed decisions about resource allocation, campaign planning, and sales strategies.
#4 Campaign Performance Report
✅ Data sets
This is a complete campaign performance dashboard with details on the channel, the campaign owner and the number of prospects assigned to a campaign. You also get the progress of the campaign, the number of opens, replies and errors for each campaign
You can then deep dive into the campaigns that need attention
✅ Use case
Utilize this report to pinpoint which campaigns are resonating with your audience. By comparing opens and response rates, you can identify the most effective channels and content types, allowing you to allocate resources to the strategies that yield the highest engagement and lead quality.
✅ How to analyze
Examine the metrics to determine the success of each campaign. High open rates indicate strong subject line appeal. Response rates will show how compelling your message is, prompting recipients to take the desired action.
A low open rate and high error rate speaks volumes on the quality of prospect list. Analyzing these rates in conjunction will give you a holistic view of your campaign’s performance.
✅ Benefits
Leveraging these insights can lead to more targeted and successful campaigns. Understanding which aspects drive engagement helps in refining messaging and optimizing future campaigns for better conversion rates.
This data-driven approach ensures that your team’s efforts are focused on the most promising strategies, ultimately boosting sales and revenue.
- Deal management and forecasting
SmartReach helps you stay on top of your sales pipeline for predicting future sales and revenue through its deal management and forecasting reports. Here’s how you can predict future sales using the reports –
#1 Prospects Contacted Report
Also known as Top of the Funnel Sales Execution Report, helps you assess the effectiveness of their prospecting efforts and top-of-the-funnel activities.
✅ Data sets
Total prospects contacted, total prospect replies, total opportunities created, conversion rate, funnel progression, Top 7 prospect lists, Top 7 team members on the basis of outreach, top campaign in terms of overall engagement
✅ Use case
By tracking the conversion rate from prospects contacted to qualified leads and monitoring the progression of contacted prospects through the sales funnel, sales leaders can gain visibility into the health of the sales pipeline and make more accurate sales forecasts.
✅ How to analyze
To thoroughly analyze this report, you should delve into the metrics for each prospecting channel (email, LinkedIn, WhatsApp, calls, SMS), assessing contact rates, reply rates, and conversion to opportunities.
Identify the top campaigns and team members that have contributed the most to prospecting activities. Analyze their performance metrics to understand what strategies and tactics are driving success.
Evaluate the top 7 prospect lists that have contributed to prospects contacted. Determine the quality and engagement levels of these lists to identify potential areas for sourcing high-quality leads.
Calculate the conversion rate from prospects contacted to qualified leads and track the progression of contacted prospects through the sales funnel. Identify bottlenecks and opportunities for improvement in the sales process.
✅ Benefits
The report helps with Improved Pipeline Management. Sales leaders can track the health of the sales pipeline, forecast future sales, and make adjustments to sales strategies as needed to ensure consistent pipeline growth and revenue generation.
By tracking the contribution of campaigns and team members to prospecting activities, the report fosters accountability and enables you to recognize top performers, provide targeted coaching and support, and drive continuous improvement
#2 Opportunities Pipeline Report
The value of the Opportunities Pipeline report lies not just in the data itself, but in interpreting it with context and drawing actionable insights to drive positive changes in your sales organization.
✅ Data sets
SmartReach.io offers the flexibility in defining your opportunity pipeline stages, allowing you to customize it to match your specific sales process.
A few example of the stages you can set-up are demo completed, proposal sent, contract sent, negotiation, closed/won which ndicates the deal has been finalized and revenue recorded and closed/lost which indicates the deal has been unsuccessful
✅ Use case
Utilize the opportunities pipeline report to strategically guide your sales team towards prioritizing and closing high-value deals, while simultaneously identifying and addressing deals that are at risk of stalling or being lost.
This comprehensive analysis allows for a focused approach on deals that are active and progressing, ensuring resources are allocated efficiently to nurture these opportunities towards a successful closure. By monitoring deal health and prioritizing accordingly, you can effectively streamline the sales process, enhance forecasting accuracy, and ultimately drive revenue growth.
✅ How to analyze
To maximize the utility of the opportunities pipeline report, focus on dissecting conversion rates, deal sizes, and the speed of deal closures.
Delve deeper by segmenting the data for nuanced insights, monitoring trends to adjust strategies proactively, and benchmarking against targets to evaluate performance.
Integrating pipeline data with other metrics can provide a holistic understanding of sales dynamics and influence factors.
✅ Benefits
By harnessing the insights from the opportunities pipeline report, you can significantly improve deal closure rates and revenue forecasting accuracy.
This tool not only aids in identifying and rectifying potential issues early on but also enhances individual sales rep performance through data-driven coaching, fostering a culture of transparency and accountability within the team.
#3 Reply sentiment report
✅ Data sets
Get the total number of positive, negative, and neutral replies received with a breakdown based on multiple use cases such as ‘need more info’, ‘wants a demo’, and more
✅ Use case
Gauge how prospects are responding to your team’s outreach efforts. By categorizing replies as positive, negative, or neutral, they can assess overall sales engagement. Also, you can predict the revenue flow and deal closing based on the positive reply sentiments.
✅ How to analyze
Use the reply sentiment report to see how your prospects or accounts feel about your outreach and your offer. Analyze the sentiment of each response and identify the ones that indicate interest, satisfaction, or dissatisfaction. Use the feedback to improve your communication quality and offer value.
Also, you link sentiment data to specific campaigns. Assess which campaigns drive positive interactions and which need adjustments.
✅ Benefits
Improve your sales forecasting using the reply sentiment report. It helps you estimate the possible sales deals in the future.
- Prospect Management
To track your prospect activities closely, SmartReach provides important reports and analytics related to prospect management. Here’s what you can do with them –
#1 Prospect tags report
✅ Data sets
No. of prospects contacted based on prospect tags assigned (such as backlink, MQL, etc.)
Get detailed analytics to drill down on the report based on campaign name, campaign owner, campaign tags, prospect list, and duration.
✅ Use case
Tag prospects based on specific criteria (e.g., “backlink,” “MQL,” etc.). These tags allow for better segmentation, enabling personalized communication.
Keep track of leads by using specific and custom labels or tags. Understand different groups of prospects.
✅ How to analyze
Use the prospect tags report to see how your leads are segmented and labeled based on your criteria(e.g., Q3 follow-up, canceled users, etc.). Compare and analyze the performance of different groups of your list of prospects and identify your KM.
✅ Benefits
Improve your segmentation and personalization by using the prospect tags report to manage and understand your leads. Tags enable personalized messaging to tailor content based on prospect tags, ensuring relevance and improving overall engagement.
#2 Prospects list report
✅ Data sets
Prospect list owner name, prospect list name, total no. of prospects assigned, total no. of prospects contacted, No. of prospect engagements with a bifurcation of replies received, links clicked, emails bounced and emails unsubscribed.
✅ Use case
The report provides insights into prospect list ownership and assignment. You can track which team members are responsible for specific lists, ensuring accountability and efficient distribution of leads.
By analyzing the total number of prospects assigned and contacted, you can assess team productivity, identify bottlenecks, and allocate resources effectively,.
✅ How to analyze
Use the prospects list report to see the performance of outreach for individual members of your sales team. Also, use the filters to drill down this report further.
Dive into engagement metrics (replies, link clicks, bounces, and unsubscribes) for each template. Identify high-performing templates based on positive interactions (replies and link clicks). Address issues related to bounces and unsubscribes.
✅ Benefits
You can allocate prospect lists more effectively based on team capacity and workload which leads to better prospect management. Increase your lead quality and quantity by using the prospects list report. It helps you optimize your ICP.
Also, knowing the prospect list owner’s name ensures accountability. Sales leaders can recognize top-performing list owners and address any issues promptly.
#3 Prospect category report
✅ Data sets
No. of prospects based on various assigned categories (such as auto-reply, out of office, do not contact, not interested, etc.)
Also, you can delve deep into the report with advanced analytics based on campaign name, duration, campaign owner, campaign tags, and campaign list.
✅ Use case
Take a bird’s eye view of your outreach status for the total number of prospects you outreached or engaged based on multiple categories such as out of office, delivery failed, auto-reply, do-not-contact, not interested, interested, converted, not now etc.
By linking prospect categories to specific campaigns, you can gain insights into which outreach strategies work best for different types of prospects.
✅ How to analyze
Compare response rates across different prospect categories within specific campaigns. Identify which categories yield the highest engagement and conversion.
You can also investigate whether specific sales reps excel in handling particular prospect categories. This can guide coaching and training efforts.
✅ Benefits
Improve your targeting and relevance by using the prospect category report. It will help your team to optimize your prospects or lead categories.
By analyzing which categories lead to successful conversions, you can fine-tune your messaging and adjust campaign strategies.
#4 Hot prospects report
This is a report that showcases all the prospects that have engaged with your campaigns in the last week or last two weeks
✅ Data sets
You will be able to download this report based on your campaign or week range. You could also filter based on campaign tags.
The downloaded report provides data like all prospect details, and dates on last contacted, opened, clicked and replied. It also tell you how many time the prospect has opened or clicked on the email
✅ Use case
Identify and prioritize prospects who are highly engaged and likely to convert. These “hot” prospects have shown interest by interacting with your communication (replies, link clicks), making them valuable targets.
✅ How to analyze
Use the hot prospects report to see who are your most engaged and interested prospects based on their actions and behaviors.
Prioritize and follow up with these prospects and move them further along the sales funnel.
✅ Benefits
Increase your conversions and sales by using the hot prospects report. It helps you target and nurture your high-intent prospects. You can also download this report in CSV and analyze using any of the third-party software.
6. Outreach response management
SmartReach effectively manages the response your sales teams receive from various outreach campaigns and channels.
#1 Reply management report
✅ Data sets
You get the total replies received with a bifurcation of positive & negative replies. You could set a date range and filter based on campaigns, team members and channels (email, LinkedIn, etc)
✅ Use Case
Get an overview of your email campaigns and how they are performing against benchmarks such as positive reply rate, negative reply rate, no. of unsubscribers, etc.
✅ How to analyze
Identify which campaigns, team members, or channels are generating the highest response rates and positive responses. This allows sales leaders to identify successful tactics and strategies that can be replicated across the sales team for improved results.
✅ Benefits
Get insights into your outreach effectiveness and an overview of the overall performance of each campaign. Replicate the campaigns that are working great. Rectify the low-performing campaigns.
By identifying successful tactics and areas for improvement, sales leaders can refine their outreach strategies and drive better results.
SmartReach APIs – Create customized reports
As a sales leader, you understand the critical role that data-driven insights play in optimizing your team’s performance.
SmartReach.io, with its powerful APIs, help your teams to transform raw data into actionable insights that drive informed decision-making and boost conversion rates.
With the APIs you can export data from your SmartReach Campaigns to your preferred analytical platform for customized reporting based on your business needs. These APIs offer flexibility to the metrics you want to track for your sales outreach activities.
SmartReach.io’s APIs are designed to scale with businesses as they grow and evolve. Pay a visit to the Using the SmartReach API section for more details relating to API.
SmartReach Reports and Analytics: Conclusion
In conclusion, SmartReach.io reports and analytics offer a comprehensive solution for businesses seeking to optimize their email or multichannel outreach campaigns.
By providing detailed insights into campaign performance, recipient engagement, and conversion metrics, SmartReach.io empowers users to make data-driven decisions and refine their strategies for maximum effectiveness.
With its user-friendly interface and robust features, SmartReach.io simplifies the process of tracking, analyzing, and improving email outreach efforts. Whether you’re a seasoned marketer or just starting out, leveraging SmartReach.io reports and analytics can undoubtedly elevate your email marketing game and drive better results for your business.
Give it a try for FREE for 14 days. (No credit card required)
For more insights on the latest sales tools, tips and techniques, pls subscribe to SmartReach blogs.
Stop juggling tools
Book more meetings on every channel
Join 5,000+ teams running multichannel outreach from one sequence, with deliverability built in.