![]()
How to Spot Trends in Unsubscribe Rates & Optimize Email Campaigns
Email campaigns live or die by how your prospects respond.
Rising unsubscribe rates is one of the biggest red flags that kill the ROI of email outbound campaigns.
And the real challenge is knowing when unsubscribes are signaling a trend and how to adjust your sending frequency before damage is done.
If you don’t, you risk burning through leads, lowering reply rates, and hurting your domain reputation.
In this guide, you’ll learn how to:
- Spot unsubscribe trends in your cold outreach.
- Calculate the right send frequency per segment.
- Adjust sequences to reduce churn.
Why do email unsubscribe rates matter so much?
Unsubscribe rates directly reflect how your prospect feels about receiving your emails.
If people opt-out of your email list in large numbers, your campaigns are missing the mark.
According to Mailchimp’s 2024 benchmarks, the average unsubscribe rate across industries is about 0.26%. That means if your campaigns are consistently higher than this, you’re sending at a pace or style that feels intrusive.
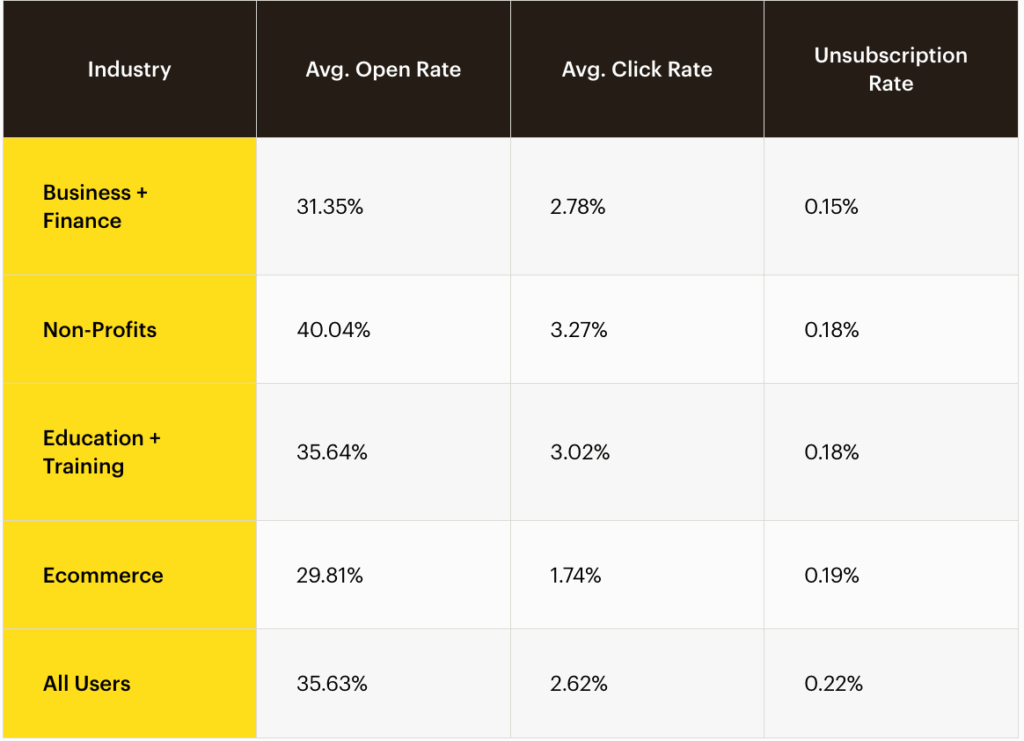
Source: Mailchimp’s 2024 email benchmarks
Apart from that, it carries the following risks –
- High unsubscribe rates damage your sender reputation, pushing future emails toward spam folders.
- SDRs spend hours building prospect lists. If too many opt out, that investment is wasted.
- Prospects who unsubscribe early never see your later value-driven emails.
What does consistent high unsubscribe rates mean for email campaigns?
Email unsubscribe rate is a normal thing even for the best performing cold email campaigns.
But the problem arises when you notice a consistently increasing email unsubscribe rate over a short period of time (e.g., over 2 weeks).
A consistently high unsubscribe rate in email campaign is usually caused by:
- Poor targeting → reaching the wrong audience/prospects.
- Irrelevant messaging → not addressing real prospect pain points.
- Excessive frequency → overwhelming recipients with too many emails in a short span.
📌 Takeaway: Tracking unsubscribe trends will help you protect your outreach, keeping your email domains healthy.
Also read: Why Hidden or Unclear Unsubscribe Links Hurt Email Deliverability
How to review email unsubscribe rate data over time?
Looking at unsubscribe rates from just one email campaign doesn’t tell you much.
You need to zoom out and study email list unsubscribe trends over time to know whether the problem is an isolated campaign or a recurring issue.
Step 1) Track unsubscribes across multiple campaigns
Pull unsubscribe reports month over month.
Compare results across different campaign types for introductory cold emails, nurture follow-ups, and promotional pushes.
Example: If your first-touch cold emails have a 0.3% unsubscribe rate but your follow-up sequences jump to 0.9%, that’s a signal your follow-up email may be too aggressive.
Step 2) Watch for seasonal or situational spikes
Unsubscribes often rise during busy seasons (e.g., December holidays or end-of-quarter campaigns).
Prospects receive more outreach, so tolerance levels drop.
Cross-check if spikes align with external factors.
For instance, sending bulk campaigns during a competitor’s big launch week may see higher churn.
Step 3) Map unsubscribes to frequency
Overlay unsubscribe data with send frequency.
Example: If you send 5 emails in 7 days and see unsubscribes double compared to a 14-day sequence, you’ve found your frequency threshold.
This makes unsubscribes less of a mystery and more of a diagnostic tool.
Step 4) Segment by audience type
Break down unsubscribes by lead source (inbound vs. scraped lists vs. referrals).
You’ll often find that cold scraped lists unsubscribe faster than warm, opted-in contacts.
This insight helps you refine targeting, not just cadence.
💡Pro tip: Don’t just rely on raw numbers. Export your unsubscribe data, plot it in a line chart, and overlay key campaign dates.
This makes it obvious when and why spikes occur.
How to calculate optimal email send frequency per segment?
Sending emails too often risks overwhelming prospects, while sending too rarely means they forget who you are.
Here’s how to do it right –
Step 1) Segment emails based on engagement signals
- Highly engaged prospects → Open or reply within 1–2 emails. You can follow up faster (every 2–3 days) since they’re clearly active.
- Low-engagement prospects → No opens/replies after 2–3 emails. Space out follow-ups to once a week to avoid looking pushy.
- Dormant prospects → If they haven’t engaged after 4–5 touches, it’s better to pause or move them into a slower nurture sequence.
Step 2) Run email frequency experiments by segment
There’s no one-size-fits-all email sending frequency. The only way to know what works is to test.
Create frequency groups:
- Group A → 5 emails in 10 days
- Group B → 5 emails in 15 days
- Group C → 5 emails in 20 days
Measure outcomes: Compare unsubscribe rates, reply rates, and positive vs. negative responses.
Spot thresholds: If Group A unsubscribes at 1% while Group B stays at 0.3% with similar reply rates, Group B is your winner.
Step 3) Monitor unsubscribe thresholds
Your unsubscribe rate should act as a warning light for over-sending. Track when unsubscribes spike within your sequence.
If 60% of unsubscribes occur after the 3rd email in a week, that’s a signal to slow down.
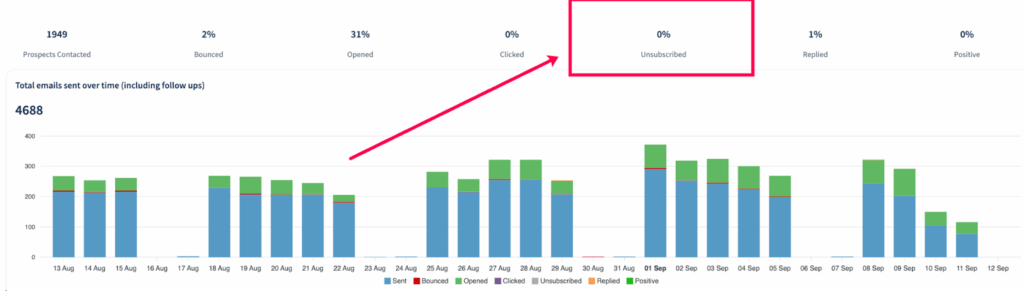
*email unsubscribe rate inside a SmartReach.io campaign
Use a platform like SmartReach.io that provides real-time email unsubscribe report along with other email campaign reports.
Use that data to reset cadence rules for future campaigns.
How to adjust email follow-up frequency to reduce unsubscribes?
If you’re using any email automation platform, just adjust your email sequence settings to prevent over-sending.
- Set limits: Cap emails per contact per week.
- Pause follow-up: Automatically stop sending if no engagement after X emails.
- Adaptive scheduling: Space out follow-ups for low-engagement contacts.
Some cold email platforms like SmartReach.io let you set custom email frequency over time.
This approach protects your email deliverability and keeps unsubscribe rates lower from the start.
- You can start new email campaigns with a low daily send volume to avoid spam flags and sudden unsubscribes.
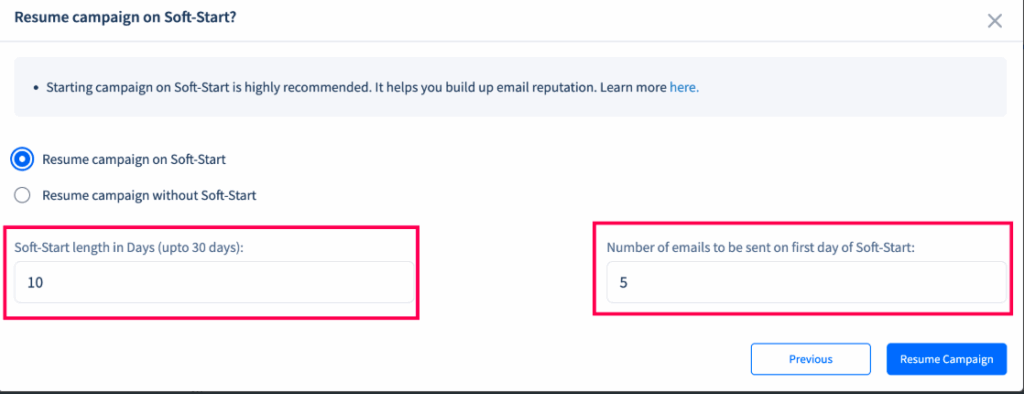
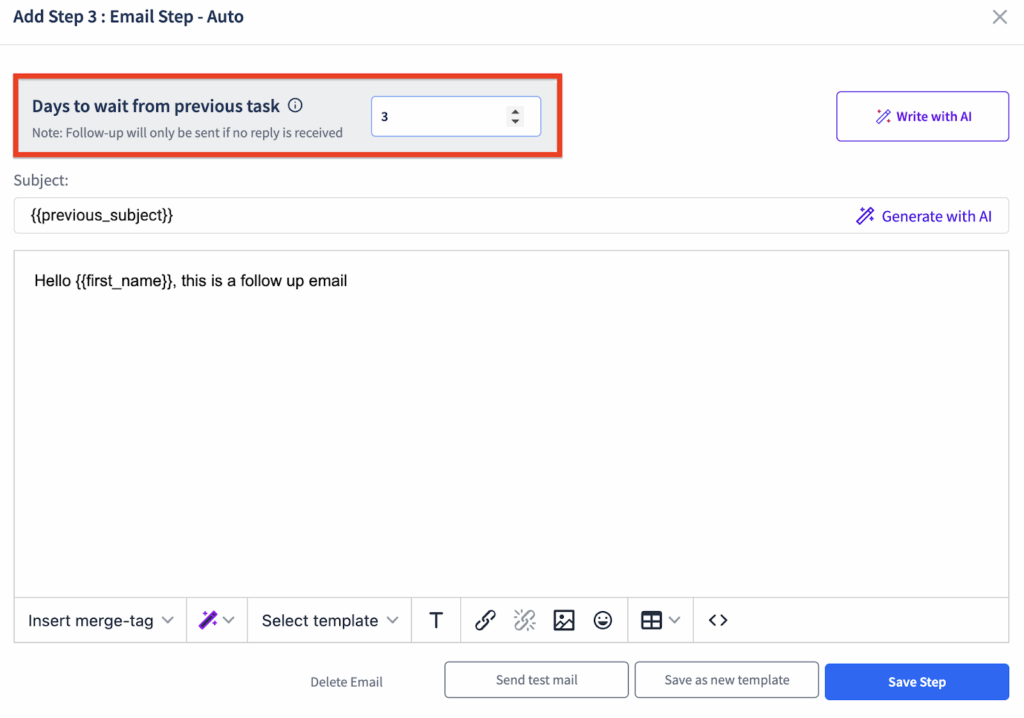
*Adjusting email campaign follow-up in SmartReach.io
- Let the system gradually ramp up email counts over several days, keeping sending patterns natural.
- Balance your outreach by mixing emails with LinkedIn or calls, so prospects don’t feel like they’re being spammed in just one channel.
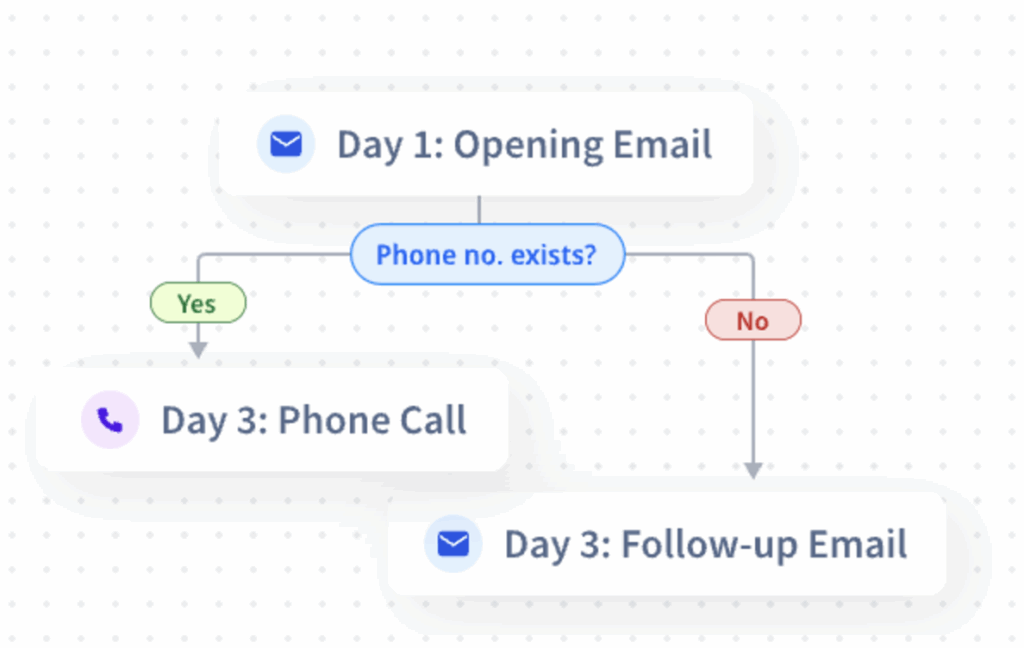
*multichannel drip sequences inside SmartReach.io
- Set up pause triggers to ensure no follow-ups are sent once a prospect replies or clicks, avoiding frustration.
- Space out your touches about 4–5 steps over 10–14 days works better than sending daily emails.
These small adjustments make your cold email campaigns less intrusive and more effective while lowering unsubscribe rates.
With SmartReach.io, you can send the right number of emails to the right people at the right time.
Try SmartReach.io for FREE (no-credit card needed!)
F.A.Qs
Q. What is a good unsubscribe rate?
Under 0.5% per campaign is considered healthy. Anything above 1% needs attention.
Q. How often should I email my list?
There’s no one-size-fits-all. Most audiences respond best to 1–3 emails per week, depending on engagement.
Q. How can SmartReach.io help reduce unsubscribes?
SmartReach.io lets you control sequence frequency, segment by engagement, and track unsubscribe trends in real time.
Q. Why do unsubscribe rates suddenly spike?
Unsubscribe spikes usually happen when you increase send frequency too fast, send irrelevant content, or keep following up after a reply.
Q. How do I track unsubscribe trends effectively?
Review unsubscribe data over weeks and months. Look for patterns by campaign type, audience segment, or send frequency to see what triggers higher churn.
Q. Can adjusting sequences really lower unsubscribes?
Yes. Spacing out emails, mixing channels, and pausing sequences after engagement makes outreach feel less intrusive, leading to fewer unsubscribes.