![]()
The A-Z of sales forecasting: How to sales forecast?
Did you know that companies with accurate sales forecasting are 10% more likely to grow their revenue year-over-year? Yet, studies show that less than 25% of sales leaders actually trust their forecast numbers.
If you’re struggling with unpredictable revenue, missed targets, or poor resource allocation, you’re not alone. Inaccurate sales forecasting costs businesses millions in lost opportunities, overstaffing, and inventory mismanagement.
This comprehensive guide will teach you 6 proven sales forecasting methods used by top-performing companies, complete with step-by-step examples, free templates, and actionable strategies you can implement today.
What You’ll Learn:
- Industry-specific forecasting strategies for SaaS, retail, and B2B companies
- 6 sales forecasting methodologies with real-world examples
- How to choose the right method for your business size and industry
- Free tools and templates to automate your forecasting process
- Common mistakes that kill forecast accuracy (and how to avoid them)
What is sales forecasting?
Sales forecasting is the process of predicting future sales revenue based on historical data, market trends, and sales pipeline analysis. It’s essentially your business’s crystal ball for revenue planning.
Here’s the simple definition: Sales forecasting estimates how much revenue your company will generate over a specific period (monthly, quarterly, or annually).
- Companies with accurate forecasting are 42% more likely to achieve their revenue goals
- Businesses lose an average of $5.2 million annually due to poor forecasting
- Organizations with strong forecasting processes see 15% faster sales cycle completion 90% of high-growth companies use data-driven forecasting methods
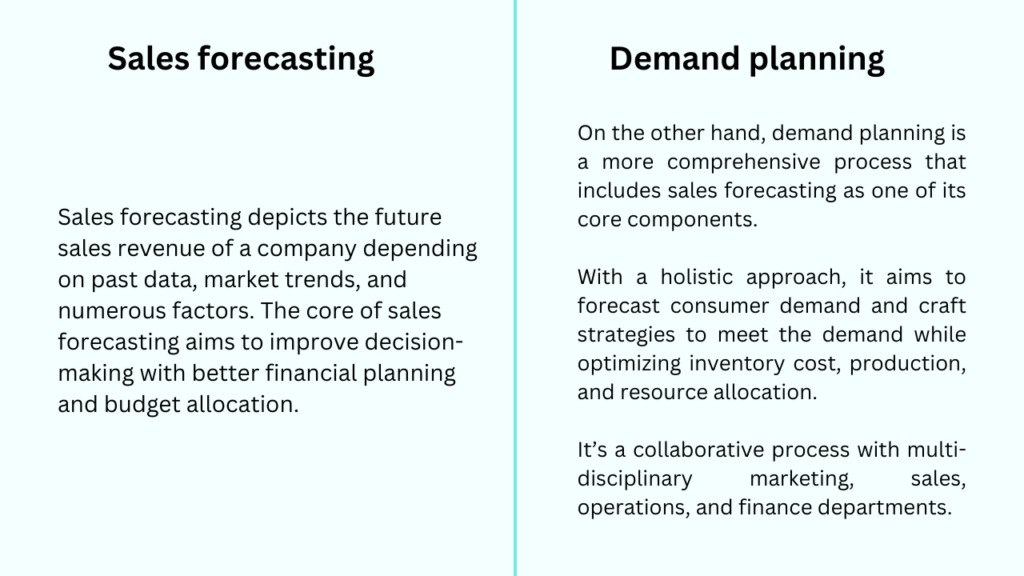
How sales forecasting is different from demand planning?
Often, what confuses people is the difference between sales forecasting and demand planning.
Though they both are for managing inventory and resource allocation, their focus areas are on varied aspects.
Why is sales forecasting so important?
With accurate sales forecasting, the company leadership can attain sales targets, release quotas for sales reps, and assess expected revenue.
This helps in overall company budgeting and spending decisions. inaccurate sales forecasting may result in overspending, putting the business at risk, and setting up unrealistic, unachievable quotas for reps. For private companies, accurate forecasting also becomes essential during liquidity events, and resources like a private company tender offer guide often highlight how projections influence valuation and shareholder decisions.
The business vitality of sales forecasting can be understood with these two use cases.
- A tech startup launching a new gadget
- A local bakery introducing specialty pastries
In the case of a tech start-up, accurate sales forecasting is vital to help manage the production timeline. Even the slightest miscalculation will lead to shortages or excess inventory, impacting the company’s revenue and customer satisfaction.
Sales forecasting with higher precision will help the startup align production with market demand, optimize resource allocation, and ensure a positive customer experience.
In the case of the local bakery, forecasting is key to estimating the demand for specialty pastries. Without accurate predictions, the bakery might face a shortage of pastries, resulting in frustrated customers or producing excess, leading to potential waste.
Realistic or accurate forecasting will maintain the right balance between customer expectations and overall business efficiency while minimizing waste.
Who is responsible for sales forecasting?
Every organization has its forecast owners depending on their business type, industry, and consumer segment. The below-mentioned list will give you an idea:
Product leaders
These are the people who will direct what to sell and when.
Sales leaders
They forecast sales their numbers depending on their teams’ predictions. Seniority plays a vital role here.
While first-line managers focus on predicting the accumulation of opportunities, third-line managers analyze a broad range of data, including traditional close rates and various numerical factors, to formulate a comprehensive forecast.
Sales reps
Their numbers will eventually form the premises of sales projections for the upper-level managers.
Besides, marketing directors, customer service managers, account managers, and even the CEO will also put their own stake.
The bottom line is everyone should know the factors affecting their sales forecasting and how all can work together to improve their projections.
Who uses sales forecast?
Almost all departments use sales forecasts to align their plan of action.
The finance dept., for instance, will use a sales forecast to make annual or quarterly investments.
The product leaders will use it to plan new demands for their products.
Your HR will refer to these forecasts to understand resource requirements and the direction of the business.
Objectives of sales forecast
A sales forecast aims to set your business’s expected growth. Business leaders will refer to these numbers to build operational roadmaps and allocate budgets accordingly. To get to the planning stage, they must be confident in these projected figures.
Without sales forecasting, business leaders must make crucial growth-related decisions in the dark. If sales don’t go as projected, the repercussions may surface in various forms, such as reducing the workforce, pausing marketing campaigns, and crucial product development.
How to build a sales forecasting plan
According to Gartner, 55% of sales leaders and 57% of quota-carrying sellers lack confidence in forecast accuracy.
It is also reported that by 2025, nearly 90% of enterprise sales organizations will rely on intuition instead of advanced analytics.
The disadvantage of making decisions on a personal hunch hits hard in the form of missed sales quotas, poor inventory, and missed opportunities with investors.
Below are some of the ways businesses can build winning sales forecast:
Setting up forecasting goals
Reviewing sales goals, sales benchmarks, and a documented sales process precedes setting up a sales forecast.
Next, use that data to set up your sales forecasting goals. Take a closer look at the last few years of business performance data regarding sales and earned revenue.
Analyzing past data gives companies a solid foundation to set sales forecasting goals. Next is to look at the future growth prospects, considering many time-bound market factors, such as economic conditions, competitor research, consumer behavior, and new legislation.
Spend on sales forecasting technology
It’s most unlikely for companies to make accurate projections without the proper tools to capture the right data, analyze it, and use it to make projections.
CRM data review is a crucial process while making your sales forecasting. You must ensure that updated CRM data is considered and your CRM is well-integrated with all data entry points across your sales process.
While looking for sales forecasting tools, you need to see the one that can capture customer sales and historical data. Moreover, the tool should have data syncing capability with relevant data solutions.
Collecting sales data
Businesses should have a mechanism to collect and store
sales forecasting related datasets continuously. Once done, the next step is to get the reports with the right set of data and make it clean.
Some of the most essential datasets to gather and analyze will be:
Sales Data
This is perhaps the most important data that businesses need to have in the forms of sales performance information, inventory data, purchasing history, and any of the other pre-established sales yardsticks.
Market and industry data
Current and economic trends that can affect the overall outcome of the company growth aspects will come here. This is what will suggest to the leaders what factors they need to consider while designing their sales forecasting.
Customer data
Anything related to customer sales-related data will fall under this category. To improve the sales cycle, businesses use customer data, including purchasing history, preferences, patterns, and demographics. This helps them better target their customer base.
Internal data
This data set refers to the internal corporate changes that may impact the company’s sales. For example, new company policies, new sales team hires, and turnover rate provide valuable insights.
How to choose a sales forecasting methodology
There’s no one good-to-go sales forecasting methodology to work with. Often, it depends on what your business chooses and on what factors.
| Method | Best For | Accuracy Level | Data Required | Time Investment | Difficulty |
| Historical | Stable markets | Medium | Low | Low | Beginner |
| Pipeline | Growing companies | High | Medium | Medium | Intermediate |
| Opportunity | Detailed tracking | High | High | High | Intermediate |
| Sales Cycle | Long sales cycles | Medium | Medium | Medium | Intermediate |
| Intuitive | New businesses | Low-Medium | Low | Low | Beginner |
| Multi-Variable | Large enterprises | Very High | Very High | High | Advanced |
Here are some of the most common sales forecasting methodologies to look at:
#1 Historical forecasting
It’s the method wherein salespeople use historical data to predict the future, assuming that history will repeat itself.
The only cons of this method is that while considering past data, the external and internal factors are not considered at the time of projection and may result in incorrect predictions.
Pros
- Based on proven past data, and can be helpful during steady market conditions.
- Quicker and easier.
Cons
- Doesn’t take into consideration of market fluctuations.
- Doesn’t consider consumer demand.
Example
A coffee shop wants to forecast its sales for the next month. They have historical sales data for the past 12 months.
| Month | Sales |
| Jan | 10,000 |
| Feb | 12,000 |
| Mar | 14,000 |
| Apr | 16,000 |
| May | 15,000 |
| Jun | 14,000 |
| Jul | 13,000 |
| Aug | 12,000 |
| Sep | 13,000 |
| Oct | 14,000 |
| Nov | 15,000 |
| Dec | 16,000 |
Calculate the average monthly sales: (sum of monthly sales)/12 = 14,333.33
Let’s calculate the 3-month moving average:
- Average of Jan, Feb, Mar = (10,000 + 12,000 + 14,000) / 3 = 12,000
- Average of Feb, Mar, Apr = (12,000 + 14,000 + 16,000) / 3 = 14,000
- …
- Average of Oct, Nov, Dec = (14,000 + 15,000 + 16,000) / 3 = 15,000
Calculate the trend:
- This helps identify whether sales are increasing, decreasing, or remaining stable.
- Use linear regression or least squares regression (LSR).
- The formula for LSR is: Y = a + bX, where
- Y is the predicted sales
- X is the month number (1 for Jan, 2 for Feb, etc.)
- a is the y-intercept
- b is the slope
- Calculate a and b using the historical data.
Forecast sales for the next month:
- Use the average monthly sales, moving average, or trendline to predict sales.
- For example:
- Average method: Sales for next month = 14,333.33
- Moving average method: Sales for next month = 15,000 (average of Nov and Dec)
- Trendline method: Sales for next month = 16,333.33 (based on LSR)
#2 Pipeline forecasting
A method where sales professionals use the current sales pipeline with other sales data. They take every sales opportunity that can be closed by the sales reps and predict. Numerous tools will help the sales forecasters to take a deep dive into the current pipeline and do the projections.
Pros
- A very reliable way to make predictions with higher accuracy.
- It considers each opportunity under the relevant factors.
Cons
- Extremely data-reliant and can be skewed easily.
- Sales forecasting tool is essential making your inventory costlier.
Example
Here’s an example of pipeline forecasting for a sales automation company:
Pipeline Data:
| Opportunity | Stage | Probability of Close | Value | Expected Close Date |
| A | Proposal | 75% | $10,000 | 2026-01-31 |
| B | Needs Discovery | 50% | $5,000 | 2026-02-15 |
| C | Solution Crafting | 80% | $15,000 | 2026-03-01 |
| D | Prospecting | 20% | $20,000 | 2026-04-01 |
| E | Negotiation | 60% | $8,000 | 2026-02-29 |
Let’s calculate the sales forecasting for Jan 2026:
- Identify opportunities with expected close dates in Jan 2026. In this case, there is only one: Opportunity A with a probability of 75% and a value of $10,000.
- Then calculate the weighted value of each opportunity. Do this by multiplying the probability of close by the value of the opportunity. For Opportunity A, the weighted value is 0.75 * $10,000 = $7,500.
- Finally, you need to sum the weighted values of all opportunities with expected close dates in Jan 2026. In this case, the sum is $7,500.
#3 Opportunity sales forecasting
One step deeper than the pipeline sales forecasting methodology. It looks at the potential sales opportunities at different pipeline stages at a more granular level. By comparing it with metrics like the average sales cycle length, sales forecasters use this data to predict future closes.
Pros
- Calculations are more objective.
- Easily integrate lead sources to forecast these opportunities better.
Cons
- Calculations don’t consider the size or type of opportunities.
- Works only with carefully tracked data.
Example
A software company is tracking several sales opportunities in various stages of the sales pipeline. They want to forecast their sales for the next quarter based on the current status of these opportunities.
Data:
| Opportunity ID | Estimated Value | Stage | Probability of Closing |
| OP-1 | $10,000 | Negotiation | 70% |
| OP-2 | $5,000 | Proposal Sent | 50% |
| OP-3 | $15,000 | Qualified Lead | 30% |
| OP-4 | $20,000 | Demo Scheduled | 20% |
| OP-5 | $8,000 | Initial Contact | 10% |
Steps:
- Identify sales stages and their historical closure rates:
- Analyze historical data to determine the average closure rate for each stage in the sales pipeline.
- In this example, suppose we have the following historical closure rates:
- Negotiation: 80%
- Proposal Sent: 60%
- Qualified Lead: 40%
- Demo Scheduled: 30%
- Initial Contact: 15%
- Calculate the weighted value for each opportunity:
- Multiply the estimated value of each opportunity by the probability of closing for its stage.
- For example:
- OP-1: $10,000 * 70% = $7,000
- OP-2: $5,000 * 50% = $2,500
- OP-3: $15,000 * 30% = $4,500
- OP-4: $20,000 * 20% = $4,000
- OP-5: $8,000 * 10% = $800
- Sum the weighted values of all opportunities:
- This represents the total expected revenue from all opportunities.
- In this example:
- Total expected revenue = $7,000 + $2,500 + $4,500 + $4,000 + $800 = $18,800
#4 Intuitive sales forecasting
A method where sales forecasters interview sales teams to collect qualitative data and stories to understand the sales process better. Capturing first-hand info is crucial; it’s equally important to use it in the data-driven forecasting method.
Pros
- Often depends on the opinions of your sales team.
- No need for historical data.
Cons
- Subjective calculations and individual reps can forecast differently.
- Can’t be scaled or replicated.
Example
Scenario: A salesperson is responsible for selling software subscriptions to local businesses. They have a good understanding of their customer base and the current market conditions. They want to forecast their sales for the next month based on their intuition and experience.
Data:
- Salesperson’s estimated average deal size: $5,000
- Number of qualified leads: 10
- Historical average close rate for qualified leads: 40%
- Salesperson’s expected conversion rate for leads: 50% (higher than average due to their strong relationships and market knowledge)
Steps:
- Estimate the number of deals likely to close:
- Multiply the number of qualified leads by the salesperson’s expected conversion rate.
- In this example:
- Estimated number of deals = 10 leads * 50% = 5 deals
- Calculate the expected revenue from closed deals:
- Multiply the estimated number of deals by the average deal size.
- In this example:
- Expected revenue = 5 deals * $5,000/deal = $25,000
- Adjust for potential risks and uncertainties:
- Consider factors like competitor activity, unexpected market changes, or individual customer preferences.
- The salesperson might decide to adjust the forecast downward by 10% due to a competitor offering a similar product at a lower price.
- Final sales forecast:
- Apply the risk adjustment to the expected revenue.
- In this example:
- Final sales forecast = $25,000 * (1 – 10%) = $22,500
#5 Length of sales cycle forecasting
Sales cycle duration forecasting centers on the time sales representatives take to finalize a deal. Usually, forecasters in sales will delve into historical data, drawing comparisons with past sales cycle durations. Subsequently, they leverage this information to generate predictions regarding forthcoming sales outcomes.
Pros
- Calculations are objective.
- Ability to integrate lead sources for better opportunity forecasting.
Cons
- Calculations don’t always consider the size or the type of opportunity.
- Works only with carefully tracked data.
Example
A marketing agency wants to forecast the length of their sales cycle for new client acquisition. They have historical data on closed deals, including the date the lead was generated and the date the deal was closed.
A marketing agency wants to forecast the length of their sales cycle for new client acquisition. They have historical data on closed deals, including the date the lead was generated and the date the deal was closed.
Data
| Lead Generation Date | Deal Close Date | Sales Cycle Length (Days) |
| 2026-01-10 | 2026-02-15 | 46 |
| 2026-02-05 | 2026-03-10 | 33 |
| 2026-03-01 | 2026-04-12 | 42 |
| 2026-04-20 | 2026-05-25 | 35 |
| 2026-05-15 | 2026-06-20 | 36 |
Steps:
- Calculate the sales cycle length for each closed deal:
- Subtract the lead generation date from the deal close date to find the number of days it took to close the deal.
- Analyze the historical data:
- Plot the sales cycle length for each deal to identify any trends or patterns.
- Calculate the average sales cycle length for all deals.
- In this example:
- Average sales cycle length = (46 + 33 + 42 + 35 + 36) days / 5 deals = 38.4 days
- Choose a forecasting method:
- Simple average: This method assumes that future sales cycle lengths will be equal to the average historical sales cycle length.
- Moving average: This method takes the average of the last n deals’ sales cycle lengths, giving more weight to recent data.
- Exponential smoothing: This method assigns weights to past data, with exponentially decreasing weight given to older data.
- Regression analysis: This method can be used to identify relationships between sales cycle length and other variables, such as lead source or deal size.
- Develop the forecast:
- Use the chosen method to forecast the sales cycle length for new deals.
- Evaluate the forecast:
- Compare the forecast to actual sales cycle lengths as new deals close.
- Monitor the forecast accuracy and adjust the model as needed.
Example:
Forecasting the sales cycle for a new lead generated on 2026-10-27:
Simple average method:
- Forecasted sales cycle length = 38.4 days
- Deal close date forecast: 2026-10-27 + 38.4 days = 2026-12-04
Moving average method (assuming n = 3):
- Moving average = (36 + 35 + 33) days / 3 deals = 34.7 days
- Forecasted sales cycle length = 34.7 days
- Deal close date forecast: 2026-10-27 + 34.7 days = 2026-12-01
#6 Multi-variable sale forecasting
The most detailed and comprehensive sales forecasting methodology. It reviews comprehensive data and makes use of predictive analytics to make sales forecasts.
Pros
Extremely data-reliant and the most accurate sales forecasting methodology.
Cons
- Because of its heavy reliance on data, it often needs an analytics tool and forecasting tools, increasing your inventory cost.
- Sales reps need to track and clean data constantly.
Example
A SaaS company wants to accurately forecast the sales cycle length for new customer acquisition. They have historical data on closed deals, including:
- Lead generation date
- Deal close date
- Deal size
- Lead source (e.g., online marketing, referral, partner)
- Sales representative
- Industry of the prospect
Steps:
- Data Preparation:
- Clean and pre-process the data to ensure accuracy and consistency.
- Encode categorical variables (e.g., lead source, industry) using appropriate techniques.
- Feature Engineering:
- Create new features that may be relevant to the sales cycle length, such as:
- Lead age (difference between lead generation and close date)
- Deal size category (e.g., small, medium, large)
- Sales representative experience level
- Create new features that may be relevant to the sales cycle length, such as:
- Model Selection:
- Choose a suitable multi-variable forecasting model, such as:
- Linear regression: This model predicts a continuous outcome (sales cycle length) based on a linear relationship with independent variables.
- Decision trees: This model uses a tree-like structure to make predictions based on a series of rules applied to the independent variables.
- Random forest: This model combines multiple decision trees to improve prediction accuracy.
- Support vector machines (SVMs): This model finds the optimal hyperplane in high-dimensional space to separate different classes (closed deals in different timeframes).
- Choose a suitable multi-variable forecasting model, such as:
- Model Training and Validation:
- Divide the data into training and validation sets.
- Train the chosen model on the training set.
- Evaluate the model performance on the validation set using metrics like mean squared error (MSE), mean absolute error (MAE), or R-squared.
- Fine-tune the model hyperparameters to improve its accuracy.
- Forecasting:
- Use the trained model to predict the sales cycle length for new leads.
- Consider using ensemble methods, which combine predictions from multiple models, to improve forecasting accuracy.
Sales forecasting challenges
Here are some of the most common challenges discussed:
➥ Historical sales data
This is quite challenging when considering a new company. The lack of historical data will complicate sales forecasting accuracy.
Making accurate predictions without historical sales data, such as operating costs, sales prices, and marketing activities, will be difficult.
Research can help overcome this challenge
If your company lacks historical sales data, you can bridge this gap by meticulously researching your competitors, target market, industry, and other relevant factors.
Companies, even with adequate past sales data, can put in an equal amount of research to make better sales forecasts.
➥ Data accuracy
Data accuracy still remains a challenge in sales forecasting as, despite the wide usage of various tools, human errors while dealing with these tools make things go wrong many times.
➥ Superficiality
Data at times may just be numerical trends without knowing the reasons for fluctuations. This approach is devoid of any use to predict future sales predictions. Every industry will have its own slow and busy period.
So, taking the data of the slow period to predict the data during the busy period will be inaccurate.
➥ Sales funnel inconsistency
A queer fact is that the sales funnel used by different employees within the same company may vary just as the sales funnels of two different companies.
Such an unstandardized sales process can end up providing misleading info and skew actual sales projections.
Which sales forecasting tools can give accurate results?
To take the guesswork out of the scene, here are a ton of sales forecasting tools available in the market. Often, it is difficult to keep track of all the variables while making sales forecasts, tools can do it diligently.
All you have to do is to set the parameters and the rest will be taken care of by the software.
Some undeniable benefits of sales forecasting tools are:
- Sales forecasting software will help you understand your inventory requirements at the tip of your fingers.
- Spot trends that will help quickly adopt to the market changes well within time.
- You can actually learn the prospect of future sales prospects with the help of your past data and predict efficiently production cost, product or service demand, etc.
There are a number of sales forecasting tools and some of these are listed below.
1. SmartReach.io (Free CRM + Forecasting)
- Best for: Small businesses starting with forecasting
- Features: Pipeline management, basic forecasting, email sequences
- Pricing: Free tier available
- Why we recommend it: Built-in forecasting with free CRM makes it ideal for beginners
2. HubSpot Sales Hub (Free)
- Best for: Companies already using HubSpot
- Features: Deal pipeline, basic reporting, contact management
- Pricing: Free with paid upgrades
- Limitation: Advanced forecasting requires paid plans
Mid-Range Solutions ($50-$200/month)
3. Pipedrive
- Best for: Visual pipeline management
- Features: Pipeline forecasting, goal tracking, mobile app
- Pricing: $12.50-$99/user/month
- Strength: Intuitive interface, strong mobile experience
4. Salesforce Essentials
- Best for: Growing businesses needing scalability
- Features: AI-powered forecasting, comprehensive reporting
- Pricing: $25-$300/user/month
- Strength: Most comprehensive feature set, excellent integrations
Enterprise Solutions ($200+/month)
5. Salesforce Sales Cloud
- Best for: Large enterprises with complex needs
- Features: Einstein AI forecasting, territory management
- Pricing: Custom (typically $150-$300/user/month)
- Strength: Advanced AI capabilities, unlimited customization
6. Microsoft Dynamics 365
- Best for: Companies using Microsoft ecosystem
- Features: Predictive forecasting, Power BI integration
- Pricing: $95-$210/user/month
- Strength: Seamless Office 365 integration
Specialized Forecasting Tools
7. Anaplan
- Best for: Complex multi-variable forecasting
- Features: Advanced modeling, scenario planning
- Pricing: Custom enterprise pricing
- Use case: Large companies with dedicated analytics teams
How is sales forecasting better with CRMs than other methods
Most companies when starting, initially resort to using spreadsheets to record data. Though this works for a while, but very soon, you will see that this is not scalable.
Selling is more complex than it was ever before. It gets complicated as you need to understand how your demand generation campaigns are performing with calling insights. The more you sell the more is the need for a CRM.
Historical data
CRM software will maintain all the records of past interactions, deals, and customer details. By analyzing your past data on closed deals, win rates, and the sales cycle length will help you make more accurate sales predictions.
Pipeline visibility
With CRM you can have a clear view of your pipeline detailing the current status of deals at various stages. You can assess the health of the deals and can make better projections about a timeframe by when these will be closed.
Lead & opportunity tracking
Monitor potential deals to understand the progression of these opportunities. Sales managers can take a bet on these deals to make their sales forecasting more precise.
Secret!! – free CRM
Sales CRMs are expensive, but if you are smart you could take advantage of few sales engagement software that provides a free sales CRM. One example is SmartReach.io, you will be able to manage all your prospects via the stages you’ve set. It also provides a feature to manage your opportunities pipeline.
7 Fatal sales forecasting mistakes
Mistake #1: Over-relying on gut feelings
- The Problem: 57% of salespeople still use intuition over data
- The Fix: Start with data, then add context and judgment
- Action: Require data backing for all forecast submissions
Mistake #2: Ignoring external factors
- The Problem: Internal focus misses market changes
- The Fix: Include economic indicators, competitor actions, seasonality
- Tool: Set up Google Alerts for industry news and competitor updates
Mistake #3: Inconsistent forecasting processes
- The Problem: Different methods across teams create confusion
- The Fix: Standardize definitions, stages, and probability criteria
- Template: Create a forecasting playbook with clear guidelines
Mistake #4: Not updating forecasts regularly
- The Problem: Stale forecasts become increasingly inaccurate
- The Fix: Update forecasts weekly or bi-weekly
- System: Set automated reminders for forecast reviews
Mistake #5: Focusing only on new business
- The Problem: Ignoring expansion and churn in existing accounts
- The Fix: Include upsell, cross-sell, and churn predictions
- Method: Track expansion revenue separately from new acquisitions
Mistake #6: Poor data quality control
- The Problem: Garbage in, garbage out
- The Fix: Regular data audits and cleanup processes
- Best Practice: Validate key data points monthly
Mistake #7: No accountability for accuracy
- The Problem: No consequences for poor forecasting
- The Fix: Track and report individual forecast accuracy
- Incentive: Tie forecast accuracy to performance reviews
Sales forecasting best practices
While there are various ways to make your sales forecasting predict the most accurate sales figures, it’s in your company’s best interest to follow some of the best practices.
- Integrate your gathered info into other business processes.
- Involve as many departments as possible in the exercise to come up with accurate sales forecasting.
- Disseminate all your findings across all stakeholders.
- Combine the expertise of sales and marketing to capture qualitative data
- Use tools to capture, analyze data, and automate tasks.
- Revise your sales forecasting as often as possible to update it and keep track of the latest trends and market dynamics.
To sum it up, sales forecasting is imperative for your organizational growth.
Use your historic data diligently, study market and economic trends, take the help of technology, make people accountable for their projections, manage your inventory future-ready, and meet consumer demand with better accuracy within the specified time.
All this, just by making your sales forecasting more realistic.
TLDR
Accurate sales forecasting is key for any business that wants to succeed. This guide has explained to you the important parts, methods, and best practices for making accurate sales forecasts.
By using historical data and newer technology, you are in a position to make confident decisions even when things are uncertain. By being able to forecast sales accurately, businesses can use their resources wisely, take advantage of new opportunities, and ultimately achieve long-term success.
With a strong sales forecast plan, businesses can not only survive but also thrive. Now that you know more about sales forecasting, you can start using it to turn your business goals into reality.
FAQ: Sales forecasting
Q: How often should I update my sales forecast?
A: Most successful companies update forecasts weekly or bi-weekly. Monthly updates are the minimum for accurate planning. For fast-moving businesses, consider weekly updates with monthly comprehensive reviews.
Q: What’s a good sales forecast accuracy percentage?
A: Industry benchmarks suggest:
- Good: 75-85% accuracy
- Excellent: 85-95% accuracy
- World-class: 95%+ accuracy
Most companies start around 60-70% accuracy and improve over time.
Q: How far ahead should I forecast?
A: It depends on your business:
- Short-term: 1-3 months (most accurate)
- Medium-term: 3-12 months (for budgeting)
- Long-term: 1-3 years (strategic planning)
Focus on getting short-term forecasts accurate first.
Q: Should I forecast conservatively or optimistically?
A: Aim for realistic forecasts. Consistent conservatism can hurt growth planning, while optimism can lead to over-investment. Track your bias and adjust accordingly.
Q: What if I don’t have historical data?
A: Start with:
- Market research and industry benchmarks
- Competitor analysis
- Pilot program results
- Expert opinions from industry contacts
Begin collecting data immediately for future forecasting.
Q: How do I handle seasonality in forecasting?
A: Use seasonal adjustment factors:
- Calculate average monthly performance vs. annual average
- Apply seasonal multipliers to base forecasts
- Consider multi-year seasonal patterns for accuracy
Q: What’s the ROI of better sales forecasting?
A: Companies with accurate forecasting typically see:
- 15-20% improvement in revenue achievement
- 25% reduction in inventory costs
- 30% better resource allocation efficiency
- 40% faster response to market changes