![]()
How to Choose Team Collaboration Assessment Tools?
A team-collaboration assessment tool turns those gut feelings, “our meetings feel off”, into hard numbers on trust, communication, and shared goals.
In the next few minutes you’ll see how to pick the right diagnostic, win buy-in, and translate survey data into real change.
What is a team collaboration assessment, and why does it matter?
Think of a team-collaboration assessment tool as a routine check-up for how people work together. Instead of guessing why a sprint slipped, you gather data on trust, communication habits, and shared goals, then tackle the cause rather than the symptom.
The idea gained prominence after Google’s Project Aristotle studied 180 internal teams and found that psychological safety was the strongest predictor of performance, outranking talent and seniority.
Follow-up research echoes the point: teams with high psychological safety are 20 percent more likely to report excellent performance and 27 percent more productive overall, according to talent-platform WiFiTalents.
Neglecting collaboration hurts. A 2024 Forrester–Vonage survey showed that 40 percent of leaders blame poor collaboration for lost productivity, and 38 percent say it directly costs them business. For SAAS sales teams, where tools like SmartReach handle outreach automation but human coordination still drives deal velocity, collaboration breakdowns translate directly to missed quotas and longer sales cycles.
When you run an assessment, every voice, introvert or executive, counts equally. The resulting scorecard turns debate into data: instead of “Marketing never answers Slack,” you see a 52 out of 100 on information flow and decide together how to raise it. With a clear baseline, even a ten-point lift transforms hidden friction into a visible win the whole team can celebrate.
In short, collaboration assessments swap intuition for evidence, giving managers and employees a shared language that strengthens teamwork with intent.
Types of assessment tools
1. Personality and behavior-mapping platforms, TeamDynamics
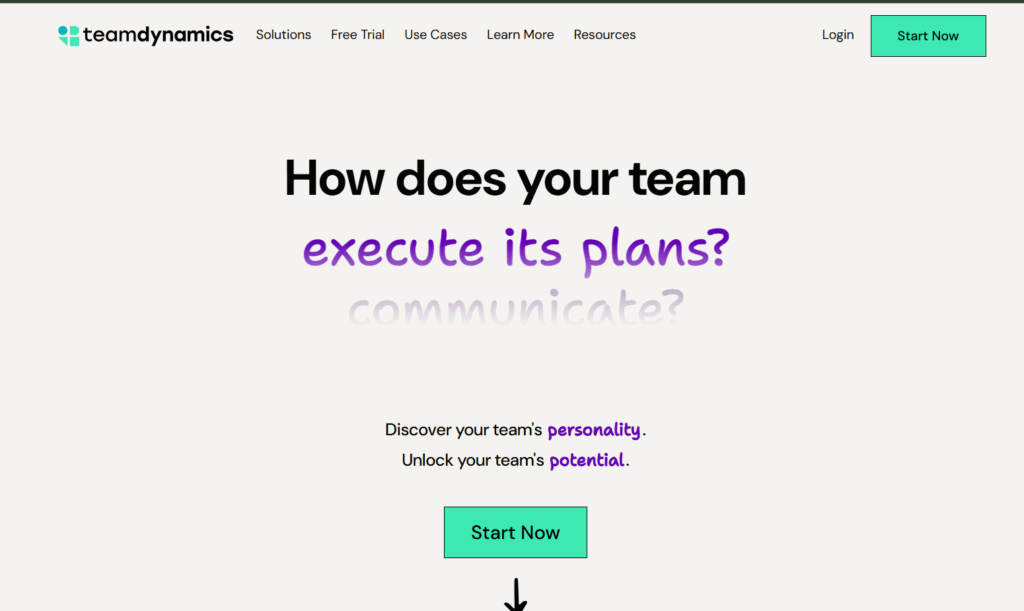
Personality is not fluff; it is the operating system beneath every email, stand-up, and deadline push. TeamDynamics employs a quick, mobile-friendly questionnaire to quantify team behaviors across four core dimensions, Communicating, Processing, Deciding, and Executing, with results then driving tailored recommendations to enhance collaboration, streamline decision-making, and boost efficiency.
Why care? When managers can see that half the squad prefers bullet-point brevity while the other half thinks in paragraph stories, they stop guessing and start adapting.
In a 2025 Predictive Index survey, 80 percent of Gen Z workers said behavioral assessments would help their teams understand one another’s strengths and work styles, second only to better leadership training as a cure for mis-alignment.
The benefit scales from the individual to the whole. A shared report becomes a user manual for collaboration, highlighting gaps, for example, a surplus of big-picture thinkers but few detail hawks, before the next sprint review derails.
The payoff is speed; style friction falls, and you can adjust meeting formats or task assignments the same day.
For distributed SAAS teams juggling tools like SmartReach.io for cold email sequencing alongside Slack threads and Zoom calls, behavioral clarity prevents wasted cycles.
When your SDR team knows that the high-Processing analyst needs data before decisions while the high-Executing rep prefers to test-and-iterate, you structure your campaign reviews accordingly and move faster.
Choose a personality-behavior platform when interpersonal static, not process design, slows momentum. Traits describe tendencies, not destinies; the insight creates value only when the team turns it into new habits.
2. Strengths-based profiles, InsightfulTraits
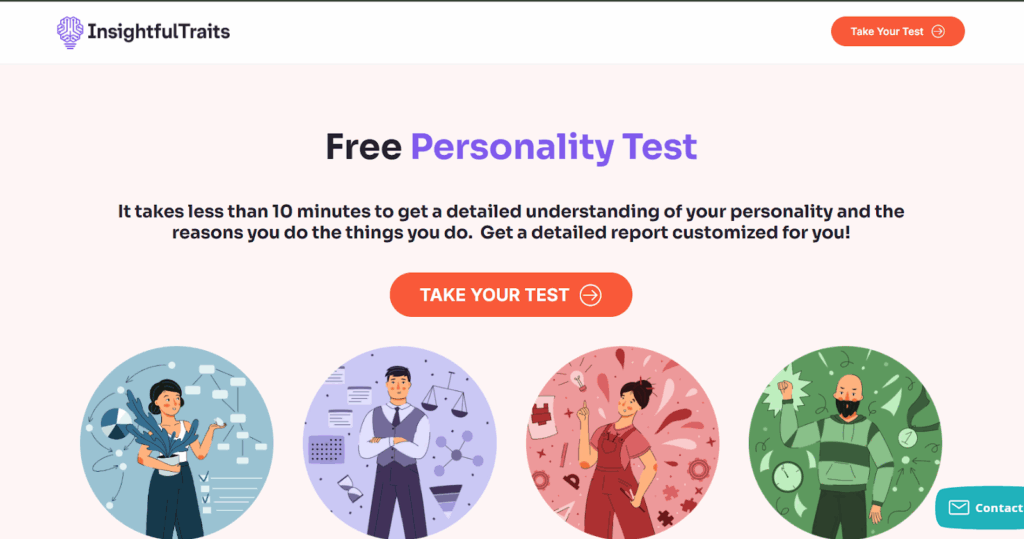
When work feels misaligned, for example, the analyst who loves big-picture thinking is buried in spreadsheets, productivity suffers. CliftonStrengths platforms like InsightfulTraits correct the mismatch by ranking 34 innate talent themes and spotlighting each person’s top five.
Gallup has studied strengths-based development for more than a decade. In its landmark analysis of 49,000 business units across 45 countries, teams that adopted strengths coaching recorded 14 to 29 percent higher profit and up to 19 percent more sales than control groups.
Engagement rose as well: workgroups saw a nine- to 15-point jump in employees who felt energized on the job.
The payoff arrives quickly. When everyone sees that Maya’s Strategic talent enjoys untangling messy roadmaps while Andre’s Relator strength shines in client conversations, managers can assign work that fits those edges instead of dulling them.
For SAAS sales teams, this means putting your high-Achiever reps on aggressive outbound campaigns powered by SmartReach automation, while your high-Empathy closers nurture warm leads through personalized follow-up.
The language stays affirmative, so no one “fails” the assessment, and adoption remains smooth for change-weary teams.
Choose a strengths profile when roles feel mismatched or motivation slips. Remember that the tool diagnoses talent, not process; you may still combine it with a survey that tracks how information moves through the organization.
3. Behavioral-style maps, EverythingDiSC
Communication misfires seldom stem from malice; they start with mismatched styles. One teammate fires off rapid directives, another replies with a novel-length message, and both walk away thinking, I was perfectly clear.
The DiSC assessment, used by platforms like EverythingDiSC, removes that guesswork by placing each person on a four-point compass, Dominance, Influence, Steadiness, or Conscientiousness.
In about 40 minutes, your team receives a color-coded guide that shows how each style prefers to send and receive information.
Does it work? A 2023 case study of a U.S. health-care chain that adopted DiSC workshops recorded a 40 percent drop in turnover and a 30 percent rise in employee engagement within 12 months; the CEO credited the gains to “speaking the same language about work style,” according to a TechBullion report.
Broader research on workplace communication shows that misunderstandings cost American companies up to $12,506 per employee each year, underscoring the price of style friction, as highlighted by The Atlantic.
In practice, DiSC assessments help sales leaders understand why their high-D account executives want three-bullet emails while their high-S customer success managers need context before taking action.
When you pair this insight with workflow automation, like SmartReach’s multichannel sequences that adapt messaging based on prospect engagement, you create a communication system that respects both internal team dynamics and external buyer preferences.
Choose DiSC when daily chatter feels draining or feedback loops stall. The vocabulary is straightforward (“high D,” “high S”), so teams adopt it quickly, and the insight leads to practical tweaks like turning a verbose Slack thread into a two-bullet summary for your Dominance-heavy product lead.
Remember that labels are starting points, not boxes; the value appears when teammates flex their style once they understand it.
4. Continuous pulse surveys, 15Five
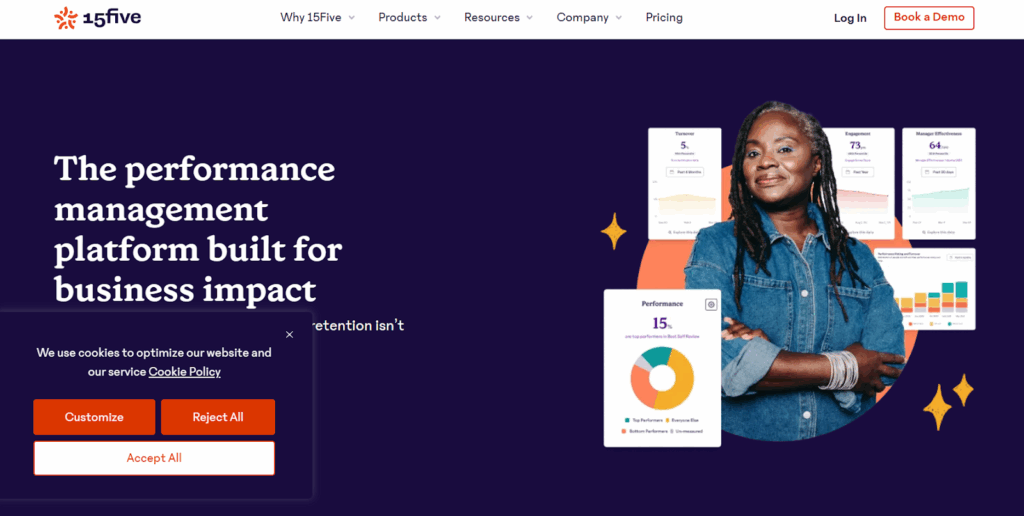
Culture shifts day by day, not quarter by quarter. Pulse-survey tools like 15Five capture those micro-changes by asking a few questions each week or month and then translating the answers into heat maps on trust, clarity, and cross-team support.
The approach works because it combines frequency with anonymity. When teammates know their comments cannot be traced back, candor rises; 15Five’s global customer data show an average participation rate of 82 percent when reminders follow the default cadence.
That honest feedback creates early-warning radar: a single dip in “I feel heard” lets you intervene before morale drops, while a steady increase in “information flows smoothly” confirms that your new stand-up ritual works.
Case studies reinforce the value. After rolling out weekly pulses, Envato recorded a 15 percent jump in overall employee sentiment within six months. Another firm, Woodard, paired pulse data with action plans and cut voluntary churn by 75 percent year over year.
For fast-scaling SAAS companies, pulse surveys fill the visibility gap that growth creates. When your sales team triples in six months and relies on SmartReach.io to maintain outreach consistency, a weekly pulse catches the moment when new SDRs feel lost in your process, before they disengage or leave.
The combination of automated workflows and human feedback loops keeps both efficiency and morale high.
Choose a pulse platform when you need real-time visibility across multiple squads or locations. Remember: insight without follow-through breeds cynicism, so schedule a brief “you said, we did” recap every cycle to prove the data lead to change.
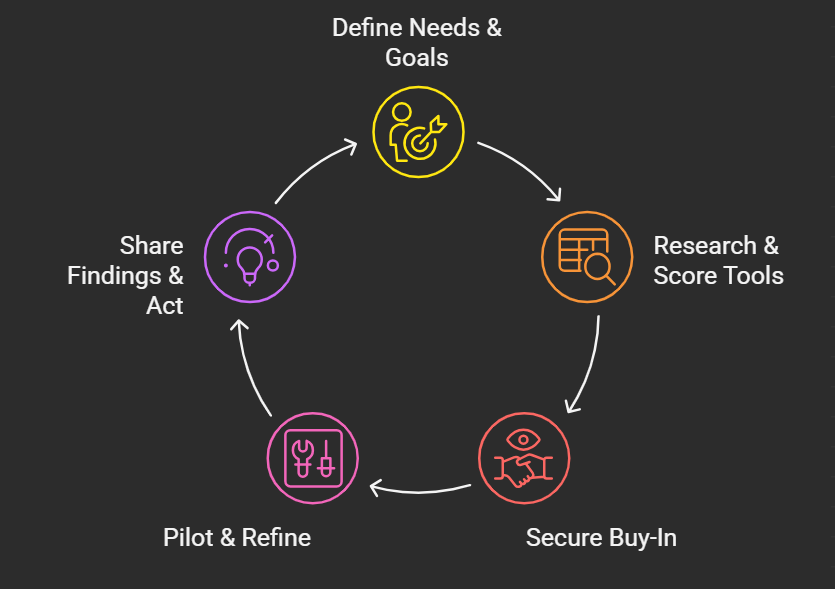
Implementation steps
Step 1: Define your team’s needs and goals
Before scheduling demos, pause and ask a simple question: What problem are we trying to solve?
Start with the friction you feel most, missed hand-offs, silent stand-ups, and duplicate work, then use a team-collaboration assessment tool like TeamDynamics to turn each pain point into a clear, trackable business metric. For example, “shorten design-to-dev cycle by one week” connects to release velocity, while “lift information-sharing score to 80” makes morale visible.
A 2023 Atlassian report found that teams with explicit collaboration KPIs were 2.3 × more likely to hit sprint goals than teams tracking only high-level project metrics. For SAAS sales organizations using platforms like SmartReach to automate outbound sequences, the collaboration metric might be “reduce account-handoff time from SDR to AE by 48 hours”, because even the smartest automation fails when internal communication lags.
Writing the metrics down does two things. First, it narrows the tool market: a strengths quiz may look appealing, but if your issue is cross-department visibility, it will not help. Second, it sets a baseline for ROI; if better hand-offs save an engineer three hours a week, you can convert that time into dollars and secure funding faster.
Peter Drucker put it plainly in 1954: “What gets measured gets managed.” The maxim still applies. When stakeholders agree on the finish line up front, scope creep fades, and the assessment never feels like an HR detour.
Step 2: Research and compare tools against your criteria
With goals in hand, turn your wish list into a simple scorecard. List columns for cost, setup time, depth of insight, and cultural fit so every trade-off stays visible when the demos begin.
How many vendors belong on that demo list? Not many. A 2023 State of B2B Software Reviews survey found that 55 percent of buyers narrow the field to three to five contenders before diving deep, and conversion rates drop when the list grows longer. Separate research on customer choice overload shows decision quality falls and evaluation time stretches once options exceed four.
During each walkthrough, keep the scorecard in view. Does the platform measure the exact friction you identified in Step 1? Will the interface feel natural to teammates already juggling six other apps? Eighty-two percent of buyers now rank ease of integration with existing tools above price, according to data from G2. If a vendor cannot explain its integrations in plain language, move on.
For SAAS teams, integration matters doubly: your stack likely includes a CRM, marketing automation (like SmartReach for multichannel outreach), Slack, and project management tools. An assessment platform that siloes data forces manual exports and kills momentum. Look for native integrations or robust APIs that push insights directly into the tools your team already uses daily.
Invite two or three future users to every demo. Their on-the-spot checks on usability can save months of regret, and the questions they send to the sales rep double as documentation when finance later asks, Why this tool rather than the cheaper one?
In the end, numbers should speak louder than hype. Tally the scores, sort high to low, and let the shortlist select itself. Decision fatigue often masquerades as diligence; your scorecard is the cure.
Step 3: Secure buy-in from the corner office to the front line
Even the smartest diagnostic fails if people roll their eyes, so sponsorship must run both deep and wide. Prosci research shows that projects with “extremely effective” executive sponsors are 79 percent more likely to hit their objectives than those with weak sponsorship.
Present the assessment as a revenue lever, not an HR hobby: “If we lift our information-sharing score by ten points, we reclaim 300 hours of rework per quarter, worth about $45k in engineering time.” For sales-driven organizations, frame it in quota impact: “When our SDRs and AEs align on handoff criteria, we shorten our sales cycle by 15 percent, turning our SmartReach automation into pipeline wins instead of abandoned sequences.” Numbers unlock budgets.
Next, shift the spotlight to the people who will take the survey. A 2024 PwC workforce study found that employees embrace change more readily when they help shape it. Invite volunteers to preview questions or test the login flow; their fingerprints turn the assessment from something done to them into something built with them.
Explain the plan in three sentences:
- Purpose: “We want fewer hand-offs lost in Slack, so we’re mapping how information travels now.”
- Promise: “Results arrive in two weeks, and we’ll share the plan the same day.”
- Privacy: “Responses are anonymized; we see trends, not individual answers.”
Clarity lowers anxiety, and follow-through builds trust. When leaders champion the why and employees co-create the how, participation soars and candor flows, powering every subsequent step.
Step 4: Pilot, tweak, and plan the full rollout
Think small before you think scale. Usability research shows that testing with five participants can uncover roughly 80 to 85 percent of the most obvious workflow snags, a pattern first quantified by Jakob Nielsen and later replicated in multiple simulations.
Run a micro-pilot with volunteers drawn from the roles that will use the assessment most. Give them the real login link, the real questions, and the real deadline; artificial conditions hide the flaws you need to see. Watch for two signals:
Friction. Did anyone stall at login, misread a question, or quit halfway? Every snag you fix now multiplies trust later.
Clarity. Do the early reports surface insights that match the goals set in Step 1? If not, refine the wording or scoring logic before you survey the full team.
Document changes as you go. A 2023 BCG analysis found that only 41 percent of pilots that seem “successful” actually scale, often because teams forget to codify what worked. Writing down each fix turns tribal memory into a repeatable playbook.
Once the bumps are ironed out, lock the logistics. Choose a quiet week, announce a firm close date, and book the results meeting on the calendar now, results lose momentum when the debrief drifts by weeks.
Step 5: Share the findings and prove you will use them
The survey closes, dashboards light up, and the temptation is to admire the charts. Resist it. Research by WorkTango shows that 77 percent of highly engaged organizations act on survey data, compared with 33 percent of disengaged peers.
Begin with a short leadership huddle to digest the numbers, then agree on two priorities, not 20. Next, bring the whole team into the story within a week; Quantum Workplace warns that delays erode trust and slash future response rates. Frame the conversation in three beats:
- Bright spots to keep – “Our design-dev handoffs scored 88; let’s document that workflow.”
- Gaps to close – “Marketing-sales alignment scored 54; we lose leads in the handoff.”
- First experiments and owners – “Sarah will pilot a weekly sync between teams starting Monday.”
Concrete timing matters. Tell the team, “We will pilot a weekly demo hour for cross-team visibility starting next Monday and review its impact in 90 days.” For SAAS sales teams, this might mean connecting your SmartReach campaign data directly to your weekly pipeline review so SDRs and AEs see the same performance metrics in real time, eliminating the “who owns this lead?” confusion that drags down conversion rates. Publishing that plan in a visible space turns accountability into a group sport.
Close the loop by scheduling a “you said, we did” recap every quarter. The Forbes HR Council notes that employees disengage quickly when feedback disappears; visible progress fuels honesty in future surveys.
Conclusion
Choosing the right team-collaboration assessment is less about flashy features and more about fit: fit for your goals, your culture, and your follow-through capacity. Start with clear metrics, involve the people who will use the tool, and commit to acting on the results.
For SAAS teams especially, where tools like SmartReach automate the mechanics of outreach but human collaboration still determines whether those leads convert, the combination of behavioral insights and process automation creates unstoppable momentum.
When data becomes dialogue, and dialogue becomes action, collaboration stops being a hunch and starts being a habit.
FAQ Section – Team Collaboration Assessment Tools
Q: What is a team collaboration assessment tool?
A: A team collaboration assessment tool is a survey or diagnostic platform that measures how effectively team members communicate, share information, and work toward common goals. It translates subjective feelings into quantifiable metrics on trust, communication clarity, and role alignment, creating baseline scores that teams can track and improve over time.
Q: How much do team collaboration assessment tools cost?
A: Pricing varies by tool type. One-time assessments like DiSC or CliftonStrengths cost $50-150 per person. Continuous pulse survey platforms like 15Five charge $4-15 per user monthly. Enterprise platforms with custom analytics may exceed $10,000 annually. Most vendors offer 7-30 day free trials before committing.
Q: How often should teams run collaboration assessments?
A: Run in-depth assessments like DiSC or CliftonStrengths annually or when onboarding 25 percent or more new members. Use lightweight pulse surveys weekly or monthly to catch emerging issues early. Fast-scaling companies benefit from quarterly deep dives plus weekly pulses to balance insight with survey fatigue.
Q: What’s the difference between DiSC and CliftonStrengths assessments?
A: DiSC maps communication styles across four behavior types to improve daily interactions and reduce misunderstandings. CliftonStrengths ranks 34 innate talent themes to align roles with natural abilities. DiSC focuses on observable behavior patterns, while CliftonStrengths identifies innate talents for strategic role design and task assignment optimization.
Q: Can collaboration assessments work for remote or hybrid teams?
A: Yes, remote teams often benefit more because digital-first work hides collaboration friction. Modern platforms like TeamDynamics and 15Five are mobile-optimized and asynchronous, letting distributed teammates complete assessments across time zones. Research shows remote teams with regular assessments report 27 percent higher productivity than those with sporadic feedback.
Q: What metrics should you track after implementing a team assessment?
A: Track leading indicators like information-sharing scores, psychological safety ratings, and decision-making clarity. Also monitor lagging outcomes including project cycle time, voluntary turnover rate, and revenue per employee. Set specific targets and review progress monthly during leadership huddles and quarterly with the full team.
Q: What’s the ROI of team collaboration assessments?
A: Google’s research found teams with high psychological safety were 27 percent more productive. Gallup’s analysis showed strengths-based teams recorded 14-29 percent higher profit. One health-care case study reported 40 percent turnover reduction. Calculate ROI by converting time savings into dollars using hourly rates.