![]()
Conversion Rate
Back to Glossary

Did you know the average website conversion rate is just 3.68% globally? That means for every 100 visitors, fewer than 4 take your desired action.
Understanding how to calculate and optimize your conversion rate is critical for improving your website’s performance, maximizing ROI, and making data-driven marketing decisions. Whether you’re tracking email sign-ups, product purchases, or demo requests, conversion rate reveals how effectively your site turns visitors into customers.
In this guide, you’ll learn:
- The exact formula to calculate conversion rate
- Step-by-step calculation examples
- Industry benchmarks (what’s “good” for your business)
- Proven strategies to improve your conversion rate
Let’s start with the fundamentals.
What is conversion rate?
Conversion rate is one of the key metrics that measure how many visitors took a specific action you want them to take, like buying a product, signing up for a service, or filling out a form, compared to the total number of people who have visited your website.
Tracking your conversion rate is essential because it reveals the effectiveness of your marketing strategies and website experience.
A high conversion rate indicates that your messaging, design, and offers resonate with your target audience, turning more visitors into customers, leads, or subscribers.
Conversion rate also signifies how well you know your target audience and how well are you able to connect with them.
How to calculate conversion rate?
Calculating the conversion rate is pretty straightforward.
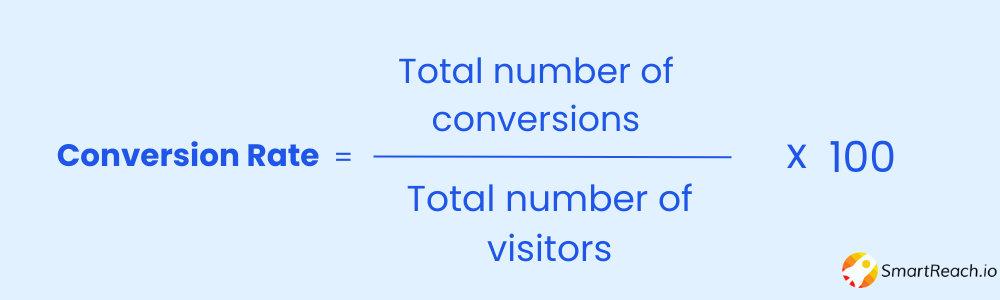
Number of Conversions: The total count of completed desired actions within a specific timeframe (e.g., purchases, sign-ups, downloads).
Total Number of Visitors (or Interactions): The total number of people who had the opportunity to convert. This could be website visitors, email recipients, or ad clicks.
Step-by-step calculation example
Let’s say you want to calculate the conversion rate for your website.
Scenario:
Website visitors last month: 500
Conversions (sign-ups): 25
Calculation:
Conversion Rate = (25 ÷ 500) × 100 = 5%
Result: Your website has a 5% conversion rate, meaning 5 out of every 100 visitors signed up.
What is a good conversion rate?
The definition of a “good” conversion rate can vary widely based on industry, business model, and the specific goals of a website or campaign.
Across all industries, a “good” conversion rate typically falls between 2% and 5%. This means if you’re converting between 2-5% of website visitors or leads into desired actions, you are in the average range.
Conversion Rate Benchmarks by Industry
| Industry | Average Conversion Rate | Good Conversion Rate | Notes |
| SaaS | 3-5% | 7-10%+ | Free trial sign-ups typically higher than paid conversions |
| E-commerce | 2-3% | 5-8%+ | Varies by product type and price point |
| B2B Services | 2-5% | 7-12%+ | Enterprise: 1-3%, SMB: 5-10% |
| Lead Generation | 5-10% | 15-20%+ | Landing pages optimized for single CTA |
| Finance | 5-10% | 12-18%+ | High-intent traffic, complex offerings |
| Travel/Hospitality | 2-5% | 6-10%+ | Seasonal variations significant |
| Healthcare | 3-8% | 10-15%+ | Local search drives higher conversions |
If we have to check based on industries, the numbers would be different.

Pro Tip: Don’t just compare yourself to industry averages. Your “good” conversion rate depends on your traffic quality, product complexity, price point, and customer journey length. A $10 product should convert higher than a $10,000 B2B software solution.
Why are conversion rates important?
Conversion rates are one of the most critical metrics for measuring business success.
Here’s why they matter:
Measure Effectiveness
Your conversion rate directly reflects how well your website, marketing campaigns, and user experience perform.
A declining conversion rate signals problems in your funnel, whether it’s unclear messaging, poor design, slow load times, or misaligned targeting.
By tracking this metric, you can quickly identify areas needing improvement and test solutions to optimize performance.
Revenue growth
Conversion rate directly impacts your bottom line. Higher conversion rates mean more customers acquired from the same traffic, which translates to increased revenue without spending more on acquisition.
Even a 1% improvement in conversion rate can dramatically boost your ROI. For example, improving from 2% to 3% means 50% more conversions from the same visitor volume.
Website optimization
When you analyze conversion rate alongside user behavior data (bounce rate, time on page, click patterns), you gain insights into what’s working and what’s not. Low conversion rates may indicate friction points like:
- Confusing navigation
- Weak calls-to-action
- Lengthy forms
- Slow page load times
- Poor mobile experience
- Lack of trust signals (reviews, security badges)
Addressing these issues systematically improves user experience and drives more conversions.
Customer acquisition
Optimizing your conversion rate makes customer acquisition more efficient and cost-effective.
If you’re spending $50 per visitor through paid ads, a 2% conversion rate means your cost per acquisition (CPA) is $2,500. Improve that to 4%, and your CPA drops to $1,250, cutting acquisition costs in half without changing ad spend.
Data-driven decision
Conversion rate data empowers you to make informed strategic decisions. By analyzing which traffic sources, campaigns, landing pages, and offers drive the highest conversions, you can double down on what works and eliminate what doesn’t.
A/B testing different elements (headlines, CTAs, images, layouts) against conversion rate helps you continuously refine your approach based on evidence, not assumptions.
What are the different kinds of conversions?
The world of conversions is diverse and can vary depending on your business goals and industry. Here’s a breakdown of some common types across different categories:
Website Conversions
- Sales: Completing a purchase on your online store.
- Lead generation: Filling out a contact form, requesting a quote, or downloading an e-book.
- Account creation: Signing up for a newsletter, registering for an event, or creating a user account.
- Engagement: Viewing product pages, adding items to cart, visiting specific sections of your website.
Marketing Campaign Conversions
- Click-throughs: Clicking on an ad or link in your email marketing campaign.
- Landing page visits: Reaching a specific page designed to capture leads or sales.
- Social media engagement: Likes, shares, comments, or direct messages generated by your campaigns.
- App downloads: Installing your app from a campaign or advertisement
E-commerce Conversions
- Add to cart: Adding products to the shopping cart without completing the purchase.
- Cart abandonment rate: The percentage of users who abandon their cart before checkout.
- Average order value: A key metric to increase AOV eCommerce sales, representing the average amount spent per order.
- Customer lifetime value: The total revenue generated by a customer over their relationship with your brand.
Other Conversion Examples
- Event registrations: Signing up for webinars, workshops, or conferences.
- Phone calls: Generating leads or inquiries through phone calls initiated from your website or advertising.
- Software trials: Starting a free trial of your software or service.
- Product demos: Scheduling or requesting a demonstration of your product.
What factors impact the conversion rate?
Numerous factors influence whether a visitor converts. Understanding these helps you identify optimization opportunities:
Traffic source & quality
Different channels bring visitors with varying intent. Organic search traffic typically converts better than social media traffic because users are actively searching for solutions. Paid search can convert well if keywords match intent closely.
Types of conversions:
The complexity of your desired action affects conversion rates. Asking for an email address converts higher than asking for a credit card.
Low-commitment actions (download a guide) convert better than high-commitment ones (schedule a sales call).
Geographic & demographic factors
Cultural preferences, purchasing power, and online behaviors vary by region. B2B audiences convert differently than B2C. Enterprise buyers have longer decision cycles than small business owners.
Messaging on landing pages:
Your landing page must clearly communicate:
- Value proposition: What’s in it for the visitor?
- Benefits over features: How does this solve their problem?
- Trust signals: Reviews, testimonials, case studies, security badges
- Clear CTA: One primary action, visually prominent
Vague or misaligned messaging kills conversions.
Website/app optimization:
Technical and design factors that impact conversions:
- Page load speed: Every 1-second delay reduces conversions by 7%
- Mobile responsiveness: 50%+ of traffic is mobile; if your site isn’t optimized, you lose conversions
- Navigation: Users should find what they need in 3 clicks or fewer
- Form length: Shorter forms convert better (only ask for essential information)
- Visual hierarchy: Guide users’ eyes toward your CTA
Device types:
Mobile users behave differently than desktop users. Mobile conversion rates are typically 30-50% lower than desktop due to smaller screens, slower connections, and on-the-go browsing. Optimize specifically for mobile to close this gap.
Trust and security signals:
Visitors need to trust you before converting:
- SSL certificates (HTTPS)
- Money-back guarantees
- Clear return/refund policies
- Privacy policy links
- Security badges (Norton, McAfee)
- Customer testimonials and reviews (with photos/names)
- Media mentions or awards
- Professional design (poor design = low trust)
Page load times:
Slow-loading pages increase bounce rates. Amazon found that every 100ms delay costs them 1% in sales. Aim for load times under 3 seconds.
Customer reviews and social proof:
93% of consumers read online reviews before making a purchase. Display reviews prominently on product pages and landing pages. Video testimonials and case studies with specific results (“increased conversions by 40%”) are especially powerful.
How to improve the conversion rate?
There are many ways to improve your conversion rate, and the best approach will depend on your specific context and goals. However, here are some tips that you can start with:
#1 Understand your target audience (ICP & Persona).
The first step is to have a clear understanding of who your audience is. You should be able to answer the below questions.
- Who are you trying to convert?
- What are their needs and pain points?
- What motivates them to make decisions?
- What are their expectations for your website or product?
- What kind of information are they looking for?
- What objections do they have?
Once you are clear about your target audience, you will be able to optimize your website, strategies, etc., and increase conversions.
Use tools like surveys, customer interviews, heatmaps (Hotjar, Crazy Egg), and session recordings to understand user behavior. The better you know your audience, the more effectively you can optimize for their needs.
#2 Optimize your website or landing pages.
Navigation & Clarity:
- Ensure your website is clear, intuitive, and easy to navigate
- Visitors should find what they need in 3 clicks or fewer
- Use descriptive menu labels (avoid vague terms like “Solutions”)
Calls-to-Action (CTAs):
- Make CTAs prominent and visually distinct (contrasting colors)
- Use action-oriented language (“Get Your Free Trial,” not “Submit”)
- Place CTAs above the fold and repeat throughout the page
- Test button colors, size, and copy (A/B test these elements)
Social Proof & Trust Signals:
- Display customer testimonials with photos and names
- Show review ratings and number of customers
- Add trust badges (security, guarantees, awards)
- Include case studies with specific results
Form Optimization:
- Keep forms short, only ask for essential information
- Use multi-step forms for complex conversions (reduces perceived effort)
- Add inline validation (show errors as users type)
- Clearly state what happens after submission
Mobile Optimization:
- Prioritize mobile-first design (50%+ of traffic is mobile)
- Use large, tappable buttons (min 44×44 pixels)
- Simplify navigation for small screens
- Test on multiple devices and browsers
A/B Testing:
- Test one element at a time (headline, CTA, image, form length)
- Run tests for at least 1-2 weeks to gather statistical significance
- Tools: Google Optimize, Optimizely, VWO
- Document results and iterate continuously
#3 Improve your offer
Relevance & Value:
- Ensure your offer directly solves your audience’s problem
- Highlight unique benefits (what makes you different from competitors?)
- Use specific, quantifiable outcomes (“Save 10 hours/week,” not “Save time”)
Risk Reduction:
- Offer money-back guarantees
- Provide free trials (7, 14, or 30 days)
- No credit card required for trials
- Clearly state cancellation policies
Urgency & Scarcity:
- Limited-time discounts (“20% off ends Friday”)
- Limited quantity (“Only 5 spots left”)
- Countdown timers (use sparingly, only if genuine)
Incentives:
- First-time buyer discounts
- Free shipping thresholds
- Bonus content or resources (“Sign up and get our free email template pack”)
#4 Make the conversion process easy
- Minimize steps: Reduce the number of clicks required to convert (ideal: 3 or fewer)
- Clear language: Avoid jargon and technical terms; write at an 8th-grade reading level
- Guest checkout: Don’t force account creation for purchases (offer it as optional)
- Autofill support: Enable browser autofill for forms
- Progress indicators: For multi-step processes, show users where they are (“Step 2 of 3”)
- Security assurance: Display SSL certificates and security badges near payment fields
- Error handling: Show clear, helpful error messages (not generic “Error 404”)
#5 Use data to drive decisions
Analytics Tools:
- Google Analytics 4 (GA4): Track user behavior, traffic sources, and conversion funnels
- Heatmaps (Hotjar, Crazy Egg): See where users click, scroll, and abandon
- Session Recordings: Watch real user sessions to identify friction points
- Google Search Console: Understand which queries drive traffic
Key Metrics to Monitor:
- Bounce rate (high = poor first impression)
- Time on page (low = content not engaging)
- Exit pages (where do users leave your funnel?)
- Form abandonment rate (which fields cause drop-offs?)
- Traffic source conversion rates (which channels convert best?)
Conversion Funnel Analysis:
- Map your entire conversion funnel (awareness → consideration → decision)
- Identify where users drop off
- Focus optimization efforts on the biggest leaks
#6 Optimize page speed
Page speed directly impacts conversions. Studies show:
- 1-second delay = 7% reduction in conversions
- 47% of users expect pages to load in 2 seconds or less
Speed Optimization Tactics:
- Compress images (use WebP format, tools like TinyPNG)
- Minimize CSS/JavaScript
- Enable browser caching
- Use a Content Delivery Network (CDN)
- Lazy load images (load as user scrolls)
- Choose fast hosting (avoid cheap shared hosting)
Test Your Speed:
- Google PageSpeed Insights
- GTmetrix
- Pingdom
#7 Personalize the experience
Personalization can increase conversions by up to 20%.
Strategies include:
- Dynamic content: Show different messages based on traffic source, location, or behavior
- Returning visitor messaging: “Welcome back! Pick up where you left off”
- Geo-targeting: Display local phone numbers, currency, language
- Behavioral triggers: If a user views a product 3 times, offer a discount
- Email retargeting: Send abandoned cart emails, browse abandonment emails
Remember, conversion rate optimization (CRO) is an ongoing process, not a one-time fix. Continuously test, analyze, and refine your approach based on data. Small, incremental improvements compound over time, a 0.5% monthly improvement in conversion rate yields 6% annual growth.
Frequently asked questions about conversion rate
How do you calculate conversion rate?
Divide the number of conversions by total visitors, then multiply by 100. Formula: (Conversions ÷ Visitors) × 100. Example: 25 conversions from 500 visitors = 5% conversion rate.
What is a good conversion rate?
A good conversion rate is 2-5% on average across industries. However, “good” varies by industry, traffic source, and conversion type. SaaS averages 3-5%, while lead generation can reach 10-15%.
What is the average conversion rate for websites?
The global average website conversion rate is 3.68%. However, this varies significantly by industry: e-commerce averages 2-3%, B2B services 2-5%, and high-performing landing pages can exceed 10%.
What does conversion rate mean in marketing?
In marketing, conversion rate measures the percentage of people who complete a desired action (purchase, sign-up, download) from your campaign. It indicates campaign effectiveness and ROI.
How can I improve my conversion rate?
Improve conversion rates by understanding your audience, optimizing landing pages, simplifying forms, adding trust signals, improving page speed, A/B testing CTAs, and using data-driven insights to refine your approach.
What is the conversion rate formula?
The conversion rate formula is: (Number of Conversions ÷ Total Visitors) × 100. This calculates the percentage of visitors who completed your desired action.
Why is my conversion rate low?
Low conversion rates often result from poor user experience, unclear value proposition, slow page speed, weak CTAs, lack of trust signals, complex forms, or misaligned traffic sources.
What is the difference between conversion rate and click-through rate?
Click-through rate (CTR) measures ad/email clicks divided by impressions. Conversion rate measures completed actions divided by visitors. CTR shows initial interest; conversion rate shows final commitment.